6 Expert Elicitation in the Social Sciences: The case of Posttraumatic Stress Symptoms Development in Children with Burn Injuries
Abstract
Experts provide an alternative source of information to classical data collection methods such as surveys. They can provide additional insight into problems, supplement existing data or provide insights when classical data collection is troublesome. In this paper we explore the (dis)similarities between expert judgements and data collected by traditional data collection methods regarding the development of Posttraumatic Stress Symptoms (PTSS) in children with burn injuries. By means of an elicitation procedure the experts’ domain expertise are formalized and represented in the form of probability distributions. The method is used to obtain beliefs from 14 experts, including nurses and psychologists, and those beliefs are contrasted with questionnaire data collected by Egberts, van de Schoot, Geenen, & van Loey (2018) on the same issue. The individual and aggregated expert judgements are contrasted with the questionnaire data by means of Kullback-Leibler divergences. The aggregated judgements of the group that mainly includes psychologists resembles the questionnaire data more than almost all individual experts.
6.1 Introduction
Expert elicitation entails the extraction of information from experts and the translation of this information into a probabilistic representation and there are many reasons to elicit expert knowledge. For instance to supplement existing data using priors that are informed by expert knowledge (van de Schoot, Sijbrandij, et al., 2018). Alternatively, some data have information gaps that can be filled by means of expert judgements (Dodd, Yuen, Sismanidis, Seddon, & Jenkins, 2017; Fischer et al., 2013) or when data are present expert judgements can serve as a quality control for the data (Veen, Stoel, Schalken, Mulder, & van de Schoot, 2018). Elicitation can also be used for forecasting purposes (Murphy & Winkler, 1974, 1984) or when there is no data available at all (Hald et al., 2016; Ho & Smith, 1997). The use of expert knowledge is widespread across many disciplines. To give some examples, Dodd et al. (2017) elicited expert based estimates for case-fatality ratios in HIV-positive children with tuberculosis who did not receive treatment. Barons et al. (2018) describe the use of expert judgements to create decision support systems with an example in food security and Dewispelare, Herren, & Clemen (1995) describe expert elicitation in relation to the long-term behavior of high-level nuclear waste repositories. For numerous other examples on elicitation practices see for instance Chapter 10 of O’Hagan et al. (2006) listing applications in sales, medicine, nuclear industry, veterinary science and many more. Alternatively, examples using a specific elicitation tool are given in Gosling (2018), or see Cooke & Goossens (2008) who describe a data base of over 67,000 elicited judgements.
Recently, there is a growing interest in the use of expert elicitation in the social sciences. Where van de Schoot et al. (2017) only found two cases that reported the use of expert opinions to inform priors in 25 years of Bayesian statistics in psychology, this trend might slowly be changing. Gronau, Ly, & Wagenmakers (2019) elicited expert judgements on effects sizes such that these could be used in informed Bayesian t-tests, in their example related to a replication study in the field of psychology. Lek & van de Schoot (2018) elicited prior distribution from teachers concerning the math abilities of their students. Zondervan-Zwijnenburg et al. (2017b) elicited expert judgements on the correlation between cognitive potential and academic performance. Moreover, methods are being developed to facilitate expert elicitation in a flexible manner such that experts are guided in the elicitation process (Veen et al., 2017).
Whatever the reasons of the elicitation, the goal is to get an accurate representation of the experts’ beliefs and associated (un)certainty and enable the representation of the experts’ domain knowledge in terms of a probability distribution. Overconfidence of experts is one of the crucial issues in expert elicitation (O’Hagan et al., 2006), resulting in elicited probability distributions with little uncertainty. In the seminal work of O’Hagan et al. (2006) feedback is named as the most natural way to improve the accuracy of elicited beliefs and interactive software as almost essential for the effective use of feedback. This is corroborated by Goldstein & Rothschild (2014) who found that visual feedback can increase even laypeople’s intuitions about probability distributions. Over a decade has passed since the advice by O’Hagan et al. (2006) and many have followed the advice. Elicitation software can be split into more general and more custom variations. Some more general frameworks are, for instance, ElicitN which was developed by Fisher et al. (2012) for the elicitation of count data. Truong, Heuvelink, & Gosling (2013) made a web-based tool for the elicitation of variogram estimates which describe a degree of spacial dependence. The elicitator was developed for indirect elicitation, creating a scenario based elicitation (James, Choy, & Mengersen, 2010; Low-Choy, James, Murray, & Mengersen, 2012). Morris et al. (2014) developed MATCH which is based on the R package SHELF (Oakley, 2019) and which is a very general elicitation tool that allows multiple elicitation methods to be used interactively to elicit single parameters. Garthwaite, Al-Awadhi, Elfadaly, & Jenkinson (2013) developed an elicitation procedure for generalized linear and piecewise-linear models, Runge, Scherbaum, Curtis, & Riggelsen (2013) for seismic-hazard analysis and Elfadaly & Garthwaite (2017) for eliciting Dirichlet and Gaussian copula prior distributions. Sometimes more customized software is developed for specific elicitation settings (e.g. Bojke et al., 2010; Haakma, Steuten, Bojke, & IJzerman, 2014; Hampson, Whitehead, Eleftheriou, & Brogan, 2014; Hampson et al., 2015). The use of software, customized or not, to increase the accuracy of the elicited beliefs is now common practice.
In this paper we present an elicitation methodology especially designed for eliciting parameters of a Latent Growth Curve Model (LGM) regarding the development of Posttraumatic Stress Symptoms (PTSS) in children with burn injuries. LGMs are commonly used to analyze longitudinal data, especially in the social sciences (e.g. Buist, Dekovic, Meeus, & van Aken, 2002; Catts, Bridges, Little, & Tomblin, 2008; Orth, Robins, & Widaman, 2012). These models include repeated measurements of observed variables, and allow researchers to examine change or development over time in the construct of interest. For extensive explanations of LGMs see Duncan & Duncan (2004), Little (2013), and Little, Bovaird, & Slegers (2006). Because the incidence of severe burn injuries in school-aged children and adolescents is relatively low, obtaining a sufficient sample to estimate LGMs is challenging. Nevertheless, to gain knowledge on the development of posttraumatic stress symptoms in this group of children, these types of models are favored over simpler models. Expert elicitation might provide and alternative, or supplement, to data collection for cases like our motivating example where traditional data is sparse.
The main aim of this paper is to compare domain expertise, expressed by experts in an elicitation setting, to data on the same topic collected by means of traditional data collection methods. Comparing experts’ domain knowledge to traditional data collection methods can provide unique insights into the topic of interest and the perception thereof. In the remainder of this paper we first describe the methodology that is used to elicit the expert judgements. The methodology is an extension of the Five-Step Method (Veen et al., 2017), adapted to elicited multiple parameters. We elicit expert judgements from 14 experts, including nurses and psychologists. Thereafter, we compare individual expert judgements, aggregated group level expert judgements, and data collected by mean of traditional methods with one another and reflect on the elicitation procedure. Finally, we conclude the paper with a discussion section including recommendations for future research. All related materials for this study, including code and data, can be found on the Open Science Framework (OSF) webpage for this project at https://osf.io/y5evf/.
6.2 Methods
In the first section we describe the motivating example for this study. In the next section we elaborate on the elicitation procedure and software that has been developed. Finally, we describe the sample of experts (\(N=14\)) participating in the elicitation study. The study receive ethical approval from our internal Ethics Committee of the Faculty of Social and Behavioural Sciences of Utrecht University. The letter of approval can be found in the data archive on the OSF website for this project.
6.2.1 Motivating Example
The motivating example for this paper is the development of Posttraumatic Stress Symptoms (PTSS) in children after a burn event. In a prospective study on child and parent adjustment after pediatric burns, data on these symptoms were collected in three Dutch and four Belgian burn centers. Children aged 8-18 years old were eligible to participate in the study if they had been hospitalized for more than 24 hours and if the percentage total body surface area (TBSA) burned was at least 1%. In Egberts et al. (2018), a more detailed description of the overall study and sample can be found here. This sample consists of 100 children that reported on their symptoms of traumatic stress within the first month after the burn event (T1), and subsequently at 3 (T2) months post-burn. For the purpose of the current study, we also included the measures obtained 12 months (T3) post-burn. Children filled out the Children’s Responses to Trauma Inventory (CRTI, revised version; Alisic, Eland, & Kleber (2006)). This measure assesses four symptom clusters of posttraumatic stress, including intrusion (e.g., repetitive, intrusive recollections of the trauma), avoidance (e.g., avoiding conversations of the event), arousal (e.g., difficulty concentrating), and other child-specific responses (e.g., feelings of guilt). Further details on this measure can be found in Alisic, Eland, Huijbregts, & Kleber (2011).
As the current study includes three measurements of PTSS at different time points a straightforward model to analyse the development of PTSS symptoms is an LGM. Figure 6.1 provides a visual representation of an LGM for this motivating example. The model is parameterized such that the latent intercept provides an estimate for PTSS in the first month after the burn event. The latent slope describes the change in PTSS one year post-burn. Parameterizing the slope by year instead of per month is done to ease the reasoning in the elicitation procedure. Furthermore, the scale of the PTSS scores has been standardized for the data of the prospective study and for the elicitation study. The scores can fall between 0-100. A zero score means that none of the symptoms of any of the clusters of posttraumatic stress are present. A score of 100 means that all symptoms from all clusters are present to their maximum extent. A standardized cut-off value of 42 was used to indicate clinical relevance of symptoms and corresponds to the cut-off value provided in the CRTI manual.
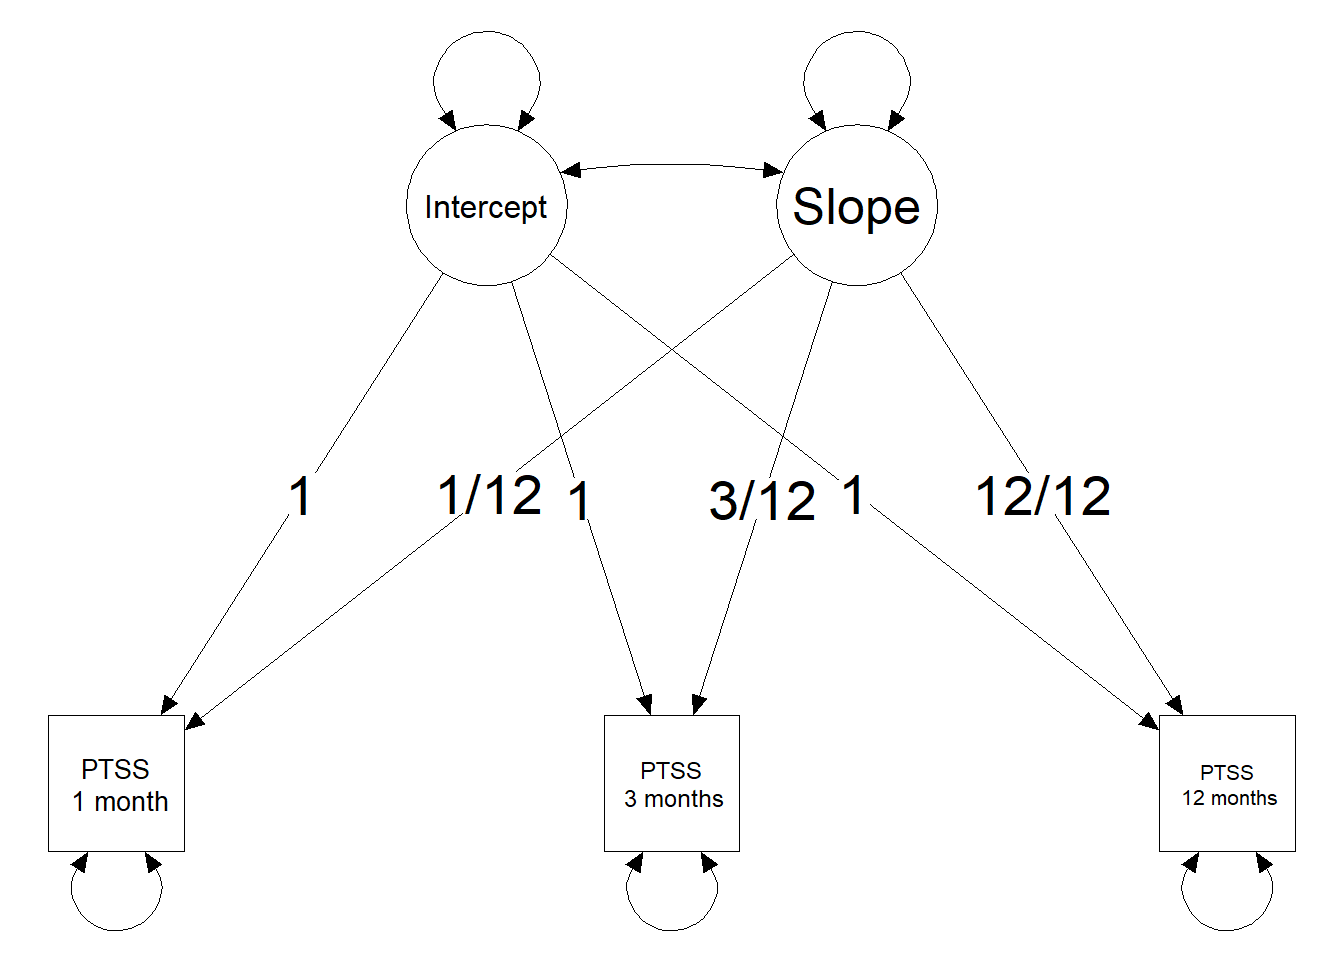
Figure 6.1: Visual representation of a Latent Growth Curve Model with three observed time points for PTSS.
6.2.2 Expert Elicitation
To optimally prepare the experts within the limited time that was allocated for each elicitation a short introduction was presented by the researchers conducting the elicitation (DV & ME), hereafter named the facilitators. The facilitators presented the experts with a brief overview of what expert elicitation is, what it can be used for and how to interpret the probability distributions that are used to represent their beliefs. Thereafter, to familiarize the experts with the elicitation procedure itself, an example elicitation for an unrelated topic was presented to the experts using the same elicitation tool. After the example elicitation the facilitators introduced the specifics related to the motivating example and the actual elicitation. The population, measurement scale, CRTI with the relevant symptom clusturs, and research question were introduced and experts were invited to ask questions to clarify any part of the procedure. Once the experts stated that they were ready to continue with the elicitation they were requested to sign the informed consent letter, which they received prior to the elicitation. If they agreed, they also agreed to the recording of the elicitation procedure. The experts were requested to reason aloud during the elicitation. The recordings were transcribed to provide additional insights in the elicitation procedure and possible differences between experts. The experts carried out the elicitation procedure using the software that is described next.
The software and procedure in this study was based on the Five-Step Method, developed by Veen et al. (2017), with a slight adaptation to elicit multiple parameters instead of a single parameter. The Five-Step Method decomposes the elicitation process in multiple smaller steps, providing visual feedback at each stage of the elicitation procedure. By decomposing the elicitation task and providing visual feedback the procedures aims to reduce bias, for instance from overconfidence. The software has been developed in the form of a shiny web application (Chang et al., 2019). Using shiny to develop elicitation tools is not uncommon, see for instance Hampson et al. (2014), Hampson et al. (2015) and the original Five-Step Method by Veen et al. (2017). In what follows we describe the Five-Step Method as implemented for this specific study, note that steps 3 and 4 were repeated for each parameter.
Step 1. Ten individual PTSS trajectories were elicited for an LGM. These individual trajectories should be representative for the population. From these individual trajectories we could deduce information on the point estimates for the average intercept and average slope parameters. This first step is called indirect elicitation because no statement is required directly concerning the parameters of interest. Figure 6.2 provides a visual representation of step one.
Step 2. Feedback was provided on the average trajectory that was based upon the ten individual trajectories that the expert provided. The expert could accept this as the average trajectory, and thereby accept point estimate for the average intercept and slope, or the expert could adjust their input in step one. Figure 6.3 provides a visual representation of step two.
Step 3. The experts provided a reasonable lowerbound and upperbound for the point estimates of the group mean intercept and the group mean slope that were obtained using steps one and two. The lowerbound and upperbound were used to determine the scale and shape of the probability distribution that was used to represent the experts’ beliefs. This is called direct elicitation because the experts provided information directly related to the parameters of interest.
Step 4. Feedback was provided on the probability distribution that was used to represent the experts’ beliefs. Figure 6.4 provides a visual representation of steps 3 and 4 with respect to the average intercept, top panel, and the average slope, bottom panel. Both single parameter feedback was provided, in the form of a probability distribution, as well as the effect on the implied average trajectory. The experts could accept the representation of their beliefs or adjust their input in step three.
Step 5. The experts were shown a summary page on the elicitation, see Figure 6.5. If the experts accepted the representation of their beliefs the probability distributions were now ready to be saved and used in the analyses.
6.2.3 Sample of Experts
Fourteen experts participated in the elicitation study. Experts from all three Dutch burn centers were included. These experts had different professions, including (child) psychologists, pediatric nurses, specialized nurses for burn injuries, and nurses with an additional masters degree (MSc). During the process of obtaining this degree, these nurses worked together closely with psychologist and observed their work. Because reporting the individual expert professions would remove almost all anonymity, we ensured that no elicited probability distributions can be associated with individual experts and therefore categorized the experts into two groups. The first group consisted of experts who have obtained an MSc degree (\(N=7\)) and the second group consisted of experts who have not (\(N=7\)). As the former group mostly consisted of psychologists or experts who have undergone at least some education in psychology we shall refer to this group as the psychologists. The later group consisted mostly of nurses with a variety of additional specializations and we shall refer to this group as the nurses. The groups we elicited judgements from are considered large enough for elicitation studies. Cooke & Goossens (1999) recommend to use the largest possible number of experts, but at least four. We were able to include seven experts in both groups of experts.
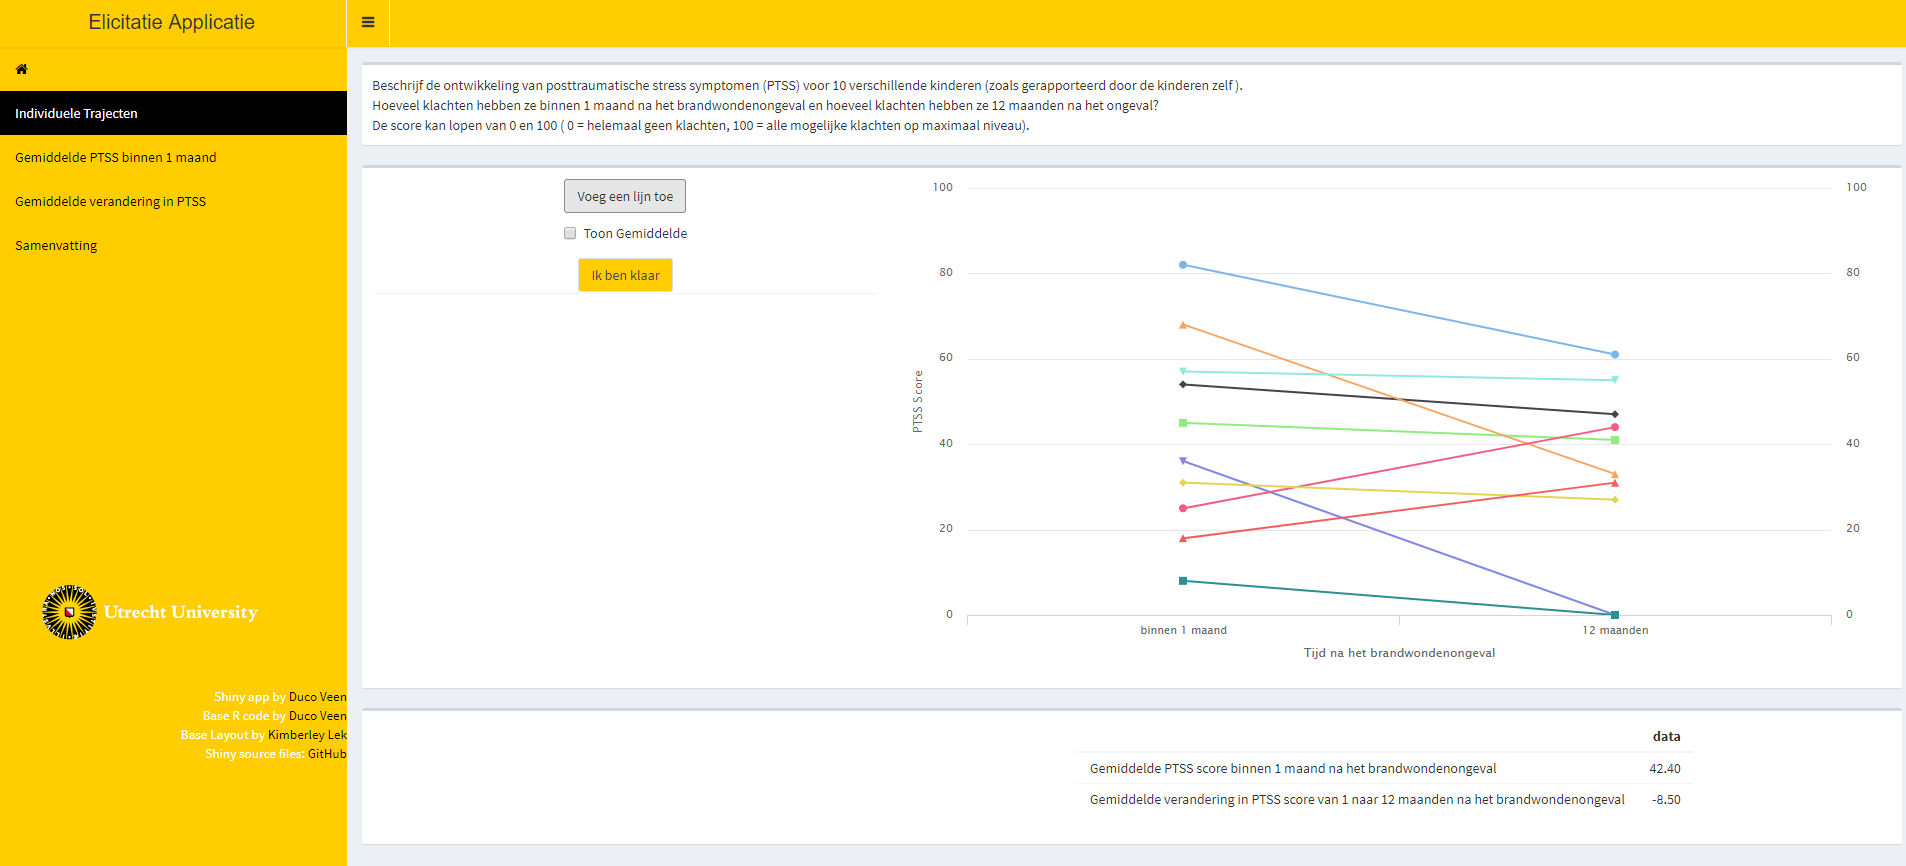
Figure 6.2: Step one of the elicitation procedure. Trajectories of PTSS development were elicited for 10 individuals that are representatitve for the population. From these trajectories point estiamtes for the average intercept and the average slope were obtained.
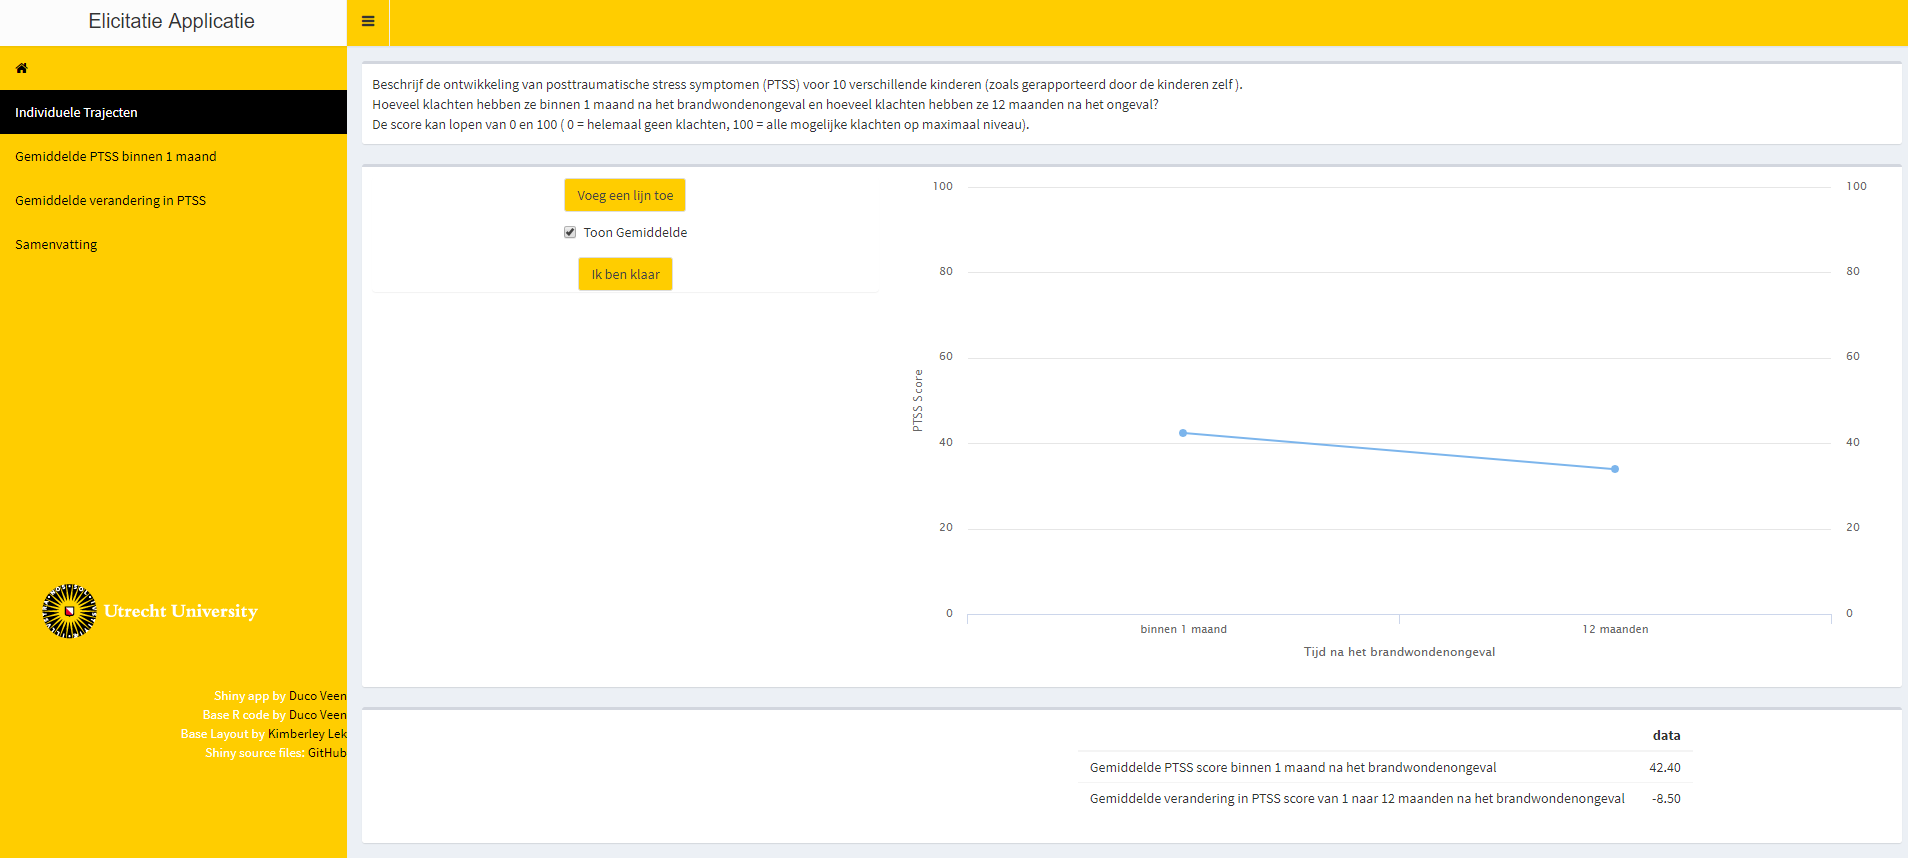
Figure 6.3: Step two in the elicitation procedure, providing visual feedback on the extracted average trajectory based upon the experts’ provided individual trajectories.
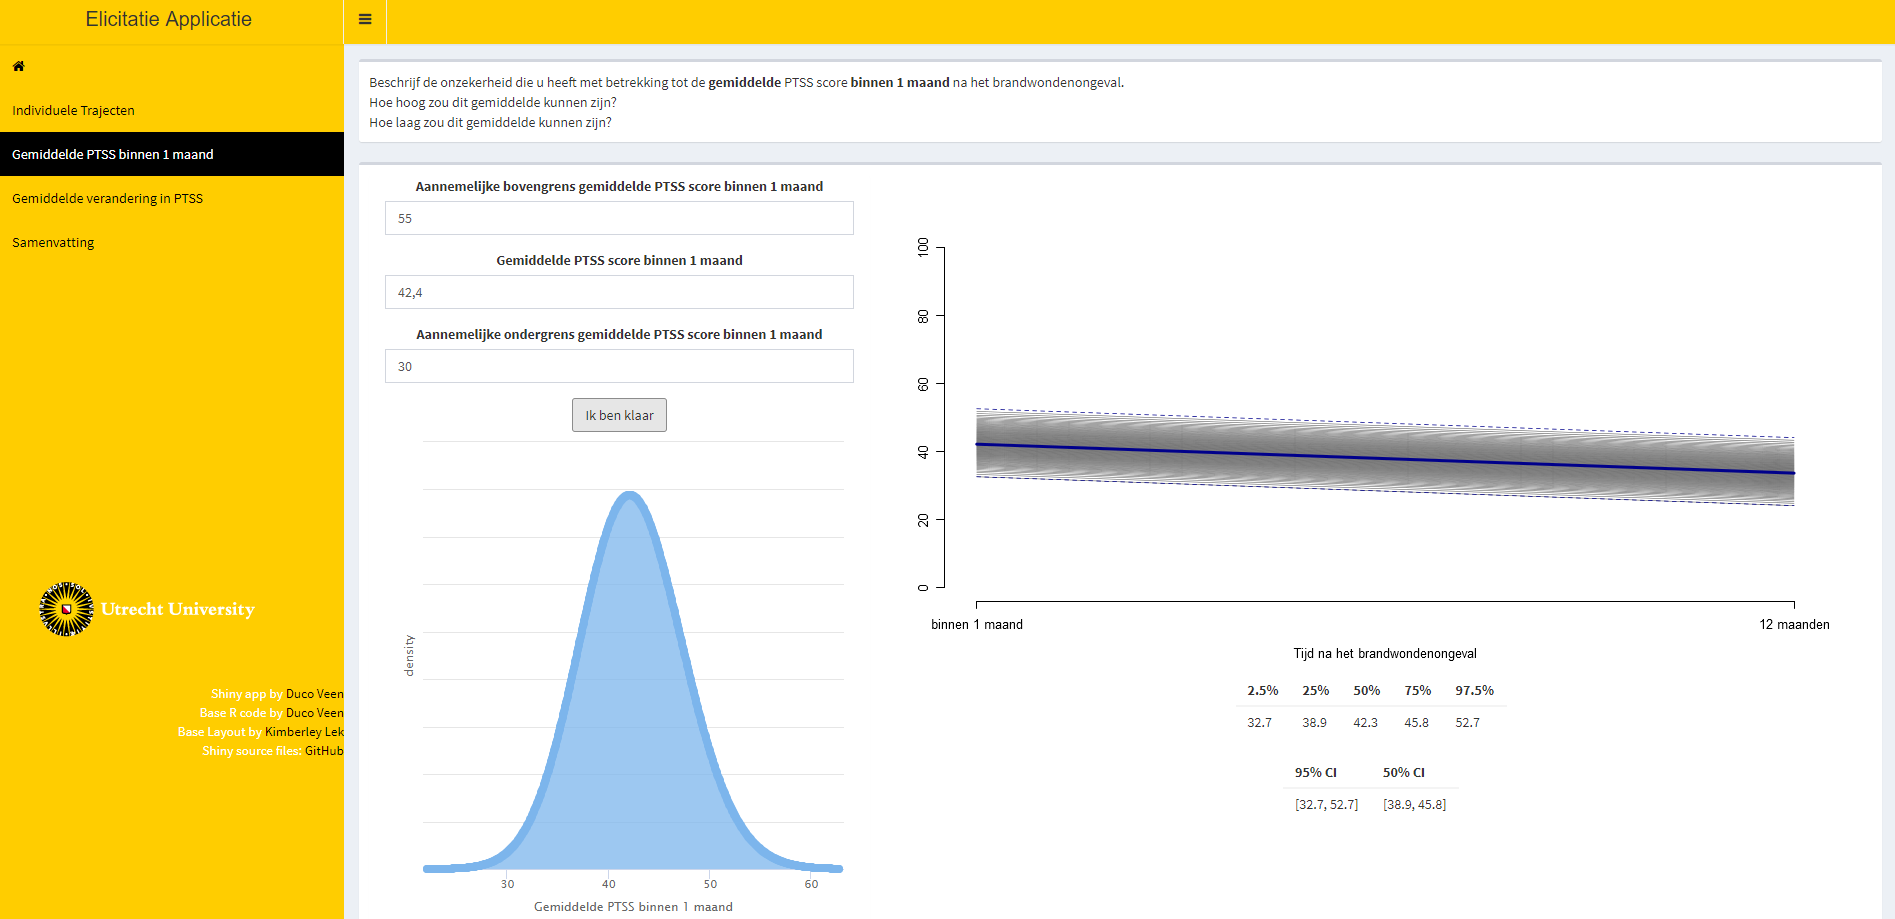
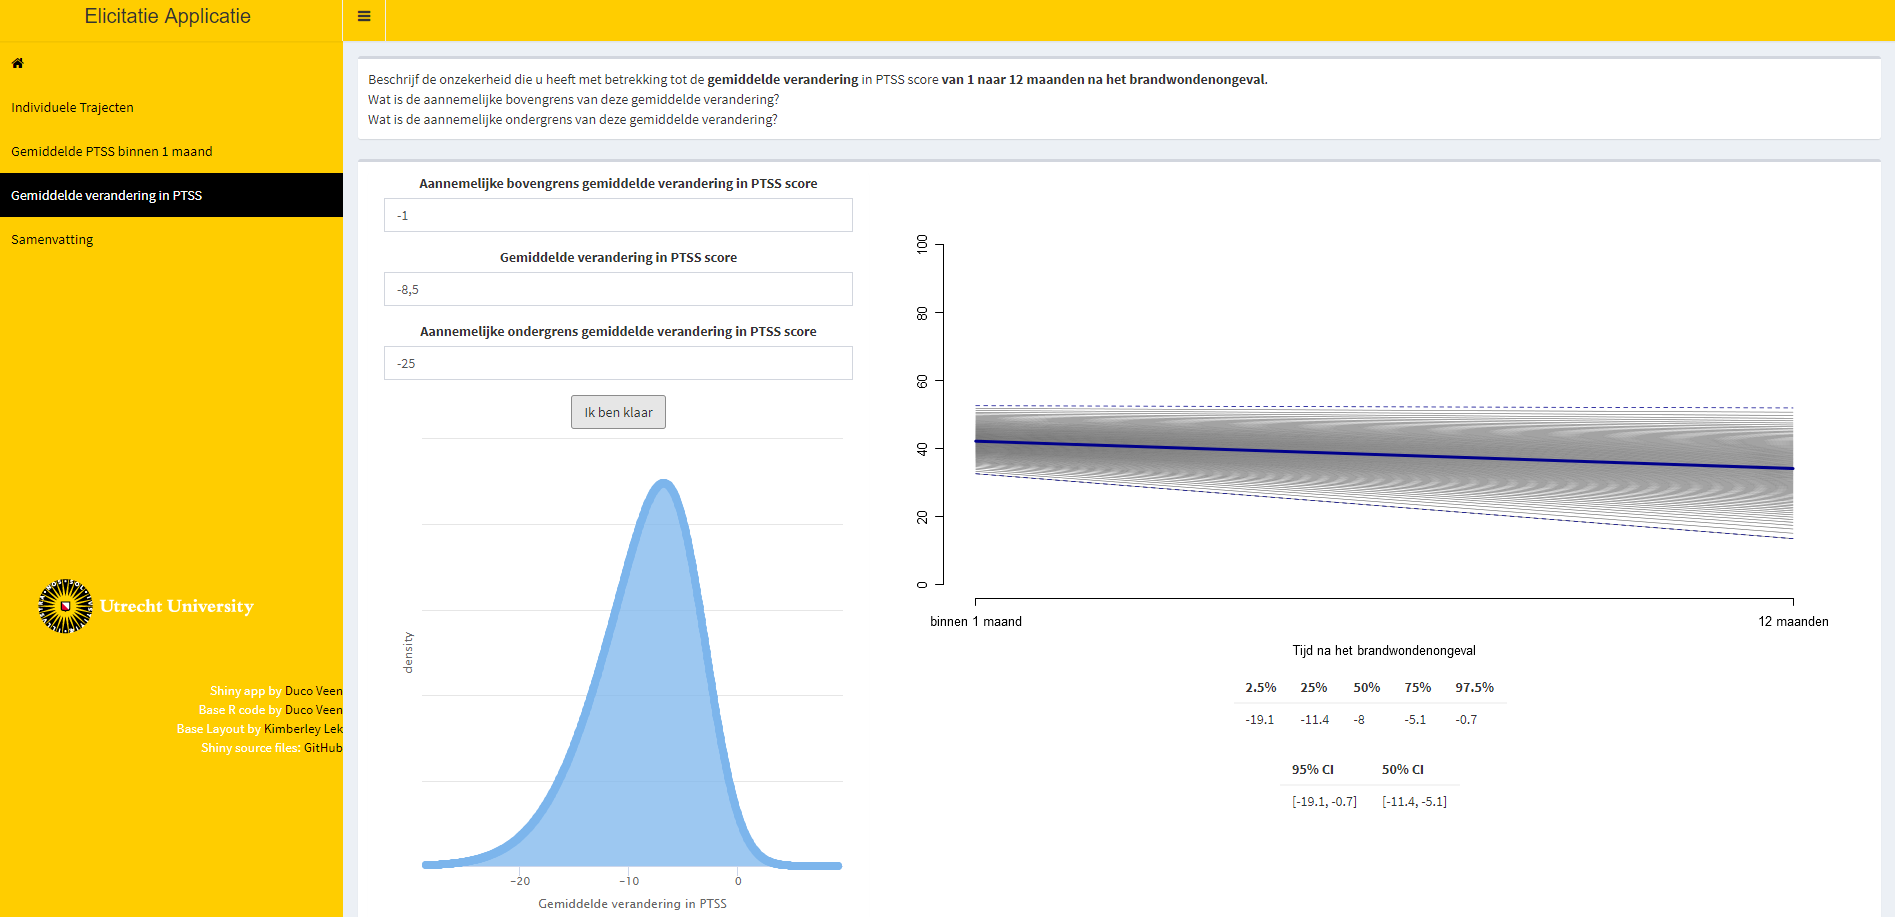
Figure 6.4: Steps three and four of elicitation procedure for the average intercept, top panel, and the average slope, bottom panel. The input that was required for step three was provided in the fields on the top left of the tab in the elicitation software. The single parameter feedback was provided on the bottom left of the tab, displaying the fitted distribution with respect to that parameter. The effect on the implied average trajectory was displayed on the right hand side of the tab. The average trajectory that was accepted in step two is diplayed and a gray band has been added around this average trajectory that represents the 95% Credibility Interval (CI) for the average trajectory. In the top panel only the uncerainty with respect to the intercept was added to the average trajectory, in the bottom panel the uncertainty with respect to both the interecept and the slope was added.
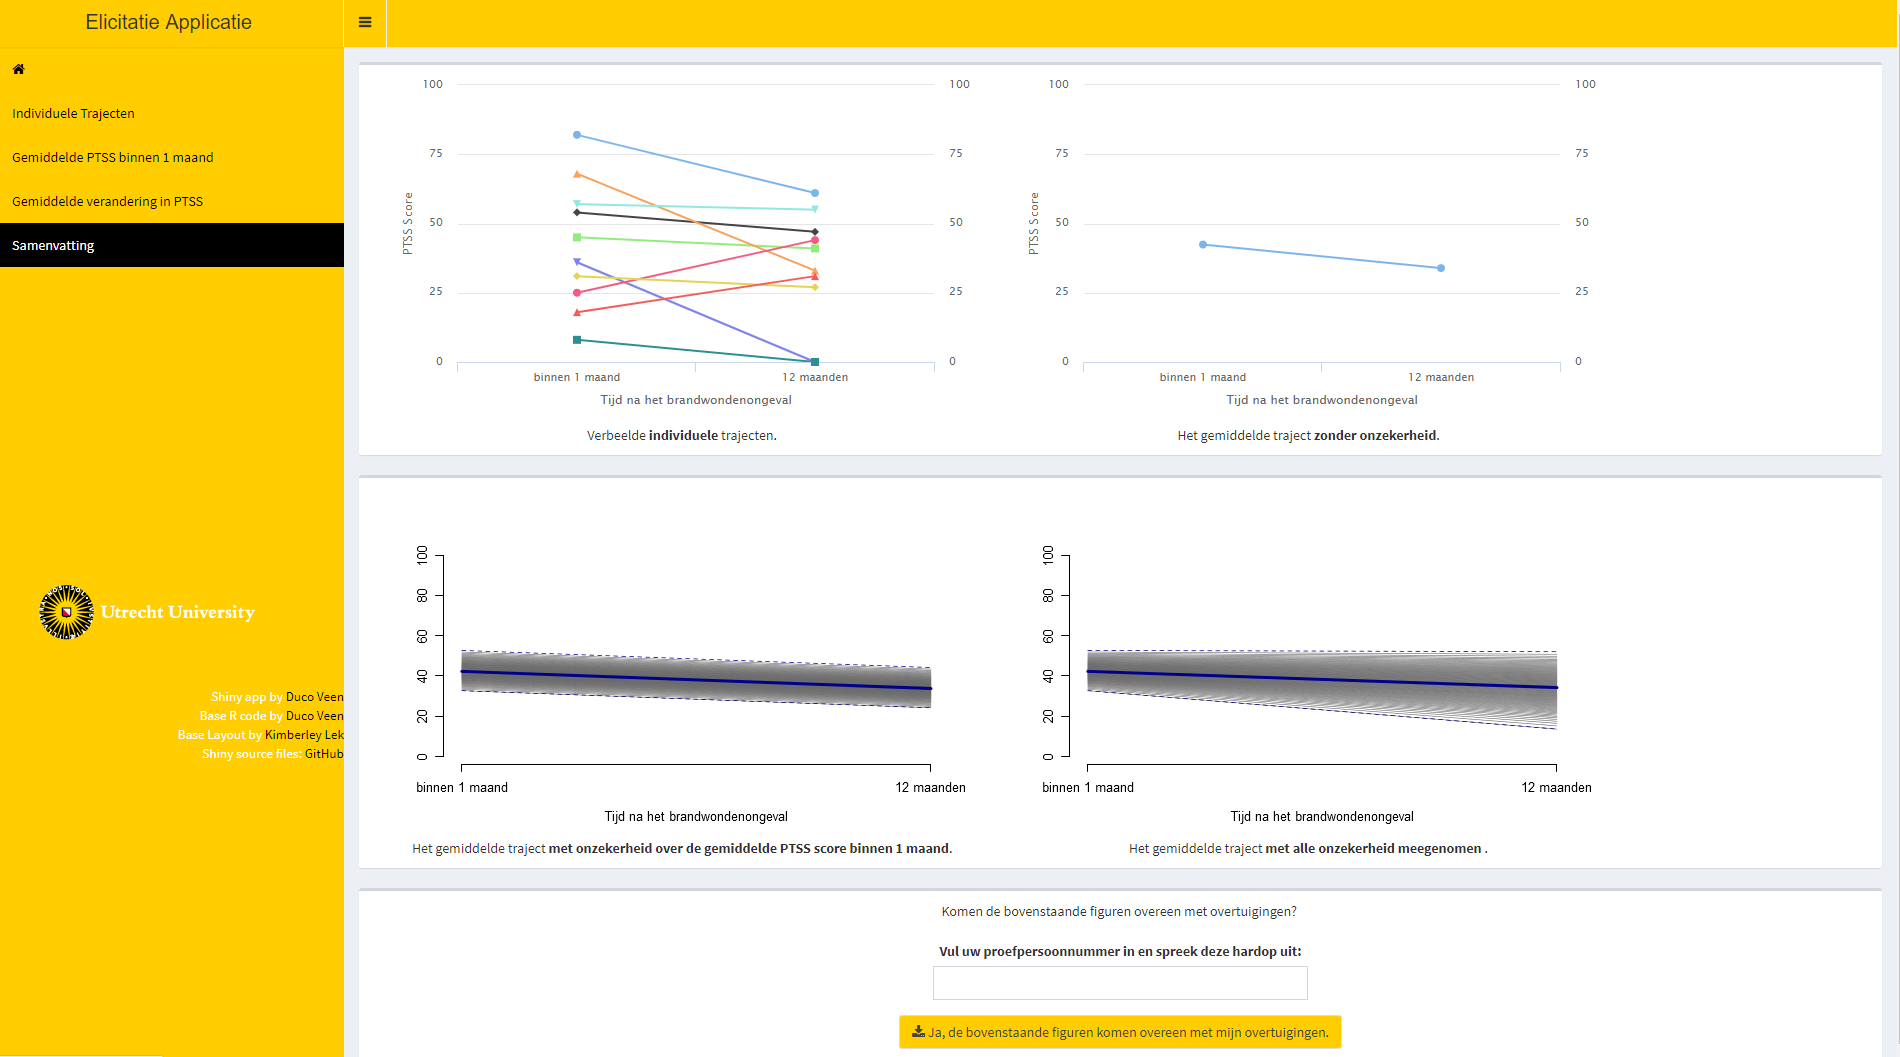
Figure 6.5: Summary page of the elicitation procedure. The top left plot within the page displayed all individual trajectories that the expert specified. The top right plot displayed the average trajectory that was obtained based on those individual trajectories. The bottom left plot displayed the average trajectory with uncertainty (95% CI) concerning the intercept value taken into account. The bottom right plot displayed the average trajectory with uncertainty (95% CI) concerning both the intercept value and the slope value taken into account.
6.3 Results
This section first covers a descriptive part on the expert judgements. We report the priors that the experts provided, the mixture priors that can be made from these expert judgements on an aggregated and group distinct level. Thereafter we report prior-data (dis)agreement measures for all individual expert judgements and the mixture distributions. These prior-data (dis)agreements are based upon the data that was collected in the prospective study by Egberts et al. (2018). Finally, we report notable results from the audio recordings. Note that the quantitative results, analyses and an overview of individual expert judgements can be found via the OSF webpage for this project at https://osf.io/y5evf/. The transcripts of the audio recordings include many identifying characteristics with respect to both the experts and patients they described during the elicitation and to preserve privacy these are not available. This is in accordance with the ethical approval agreement.
6.3.1 Individual and Group Expert Judgements
All 14 expert judgement had been elicited allowing them to specify a skewed normal distribution parameterized according to Burkner (2019). In Figure 6.6 all the elicited individual expert distributions can be found as well as the mixture distributions2 for all experts, the psychologists group and the nurses group regarding both the mean intercept and the mean slope of PTSS development. From Figure 6.6 it can be seen that the experts judgements differed quite substantially. Especially concerning the development of PTSS as expressed by the slope parameter we can see that actually expert disagreed on the direction of the effect and with a lot of confidence. When we look at the groups of experts an interesting pattern emerges. If we combine the expert judgements of the psychologists and the nurses into their respective groups the nurses turn out to have a substantially different view from the psychologists. Not only did the nurses’ judgements express a higher initial amount of PTSS to be present in the population on average, their combined view also expressed that these initial PTSS scores are quite likely to increase on average over time. The psychologists in contrast assigned almost no probability to an increase in the average PTSS score over the time period of a year, see Figure 6.7 for a closer look.
6.3.2 Prior-Data (dis)Agreement
To assess the (dis)agreement of experts’ judgements with the data from the prospective study by Egberts et al. (2018) we used Kullback-Leibler (KL) divergences (Kullback & Leibler, 1951) between the posterior distribution that is based upon the data and an uninformative benchmark prior and the individual and aggregated expert judgements. Using information theoretical distance measures to asses prior-data (dis)agreement in this manner has previously been discussed by for instance Bousquet (2008), Lek & van de Schoot (2019), and Veen et al. (2018). KL-divergences provide us with an indication of how much information is lost is we approximate distribution \(\pi_1\) by another distribution \(\pi_2\). A higher divergence indicates a higher loss of information. In this case \(\pi_1\) will be the posterior distribution based upon the data and an uninformative benchmark prior, to which we refer as the reference posterior. We approximate the reference posterior with the elicited prior distributions and report the loss of information. For an overview of the priors that are used to compute the reference posterior see Figure 6.8 and in Figure 6.9 the reference posteriors for the group mean latent intercept and slope are visualized.
In addition to comparing the expert priors to the benchmark posterior we added two other comparisons to create a frame of reference. Two benchmark situations are added and their loss of information is calculated. In the situation of benchmark 1 we would take some information regarding the measurement instrument into account. The scale of the measurement instrument was standardized such that values are between 0 and 100, therefore a \(U(0, 100)\) prior on the group mean intercept would cover all possible parameter values. With the parameterization such that the final time measurement implies a change of one times the individuals latent slope parameter, taking the standardized scale into account a \(U(-100, 100)\) prior on the latent slope covers all possible parameter values and declares them equally possible. For benchmark 2 we take an extremely conservative approach and take two \(N(0, 10^8)\) priors on the latent group mean intercept and slope.
The KL-divergences are reported in 6.1 and are the numerical representation of the loss of information that occurs by approximating the reference posteriors distributions from Figure 6.9 by the distributions that can be seen in Figure 6.7 for the experts priors. It seems that there are quite some experts that are in disagreement with the collected data from Egberts et al. (2018). There are some individuals, notably experts 9 and 13, that provide a very similar view to the collected data, whilst some experts provide a similar view with respect to one of the two parameters, e.g. experts 3 and 6. It is notable that the group of psychologists in particular and the group of experts as a whole show less loss of information with respect than the data than most experts on both parameters. Finally, what is noteworthy is that benchmark 1, which has no preference for any part of the parameter space covered by the measurement instrument, resembles the data more than most experts and more than the nurses as a group.
6.3.3 Audio Recordings
The following observations were noteworthy in the transcripts of the audio recordings. All psychologists referred back to the concept of PTSS specifically during the elicitation procedure. In the group of nurses we found a lot of mentioning of stress, but only two nurses actually referred back to PTSS specifically. Three psychologists reflected on the linearity assumption of the model and noted that non-linear trajectories often occur. Five of the nurses expressed sentiments that the more severe cases came to mind more easily and therefore might be over represented in their beliefs. Only one psychologists expressed a similar statement. Thee experts, one psychologist and two nurses, actively reflected on the visual feedback and adjusted their input in the elicitation tool based on this. One experts, a nurse, stated that although they were sure about the direction of the trajectory they felt unsure about the associated numerical representation. Finally, one expert, a nurse, repeatedly mentioned that they found the task hard to do.
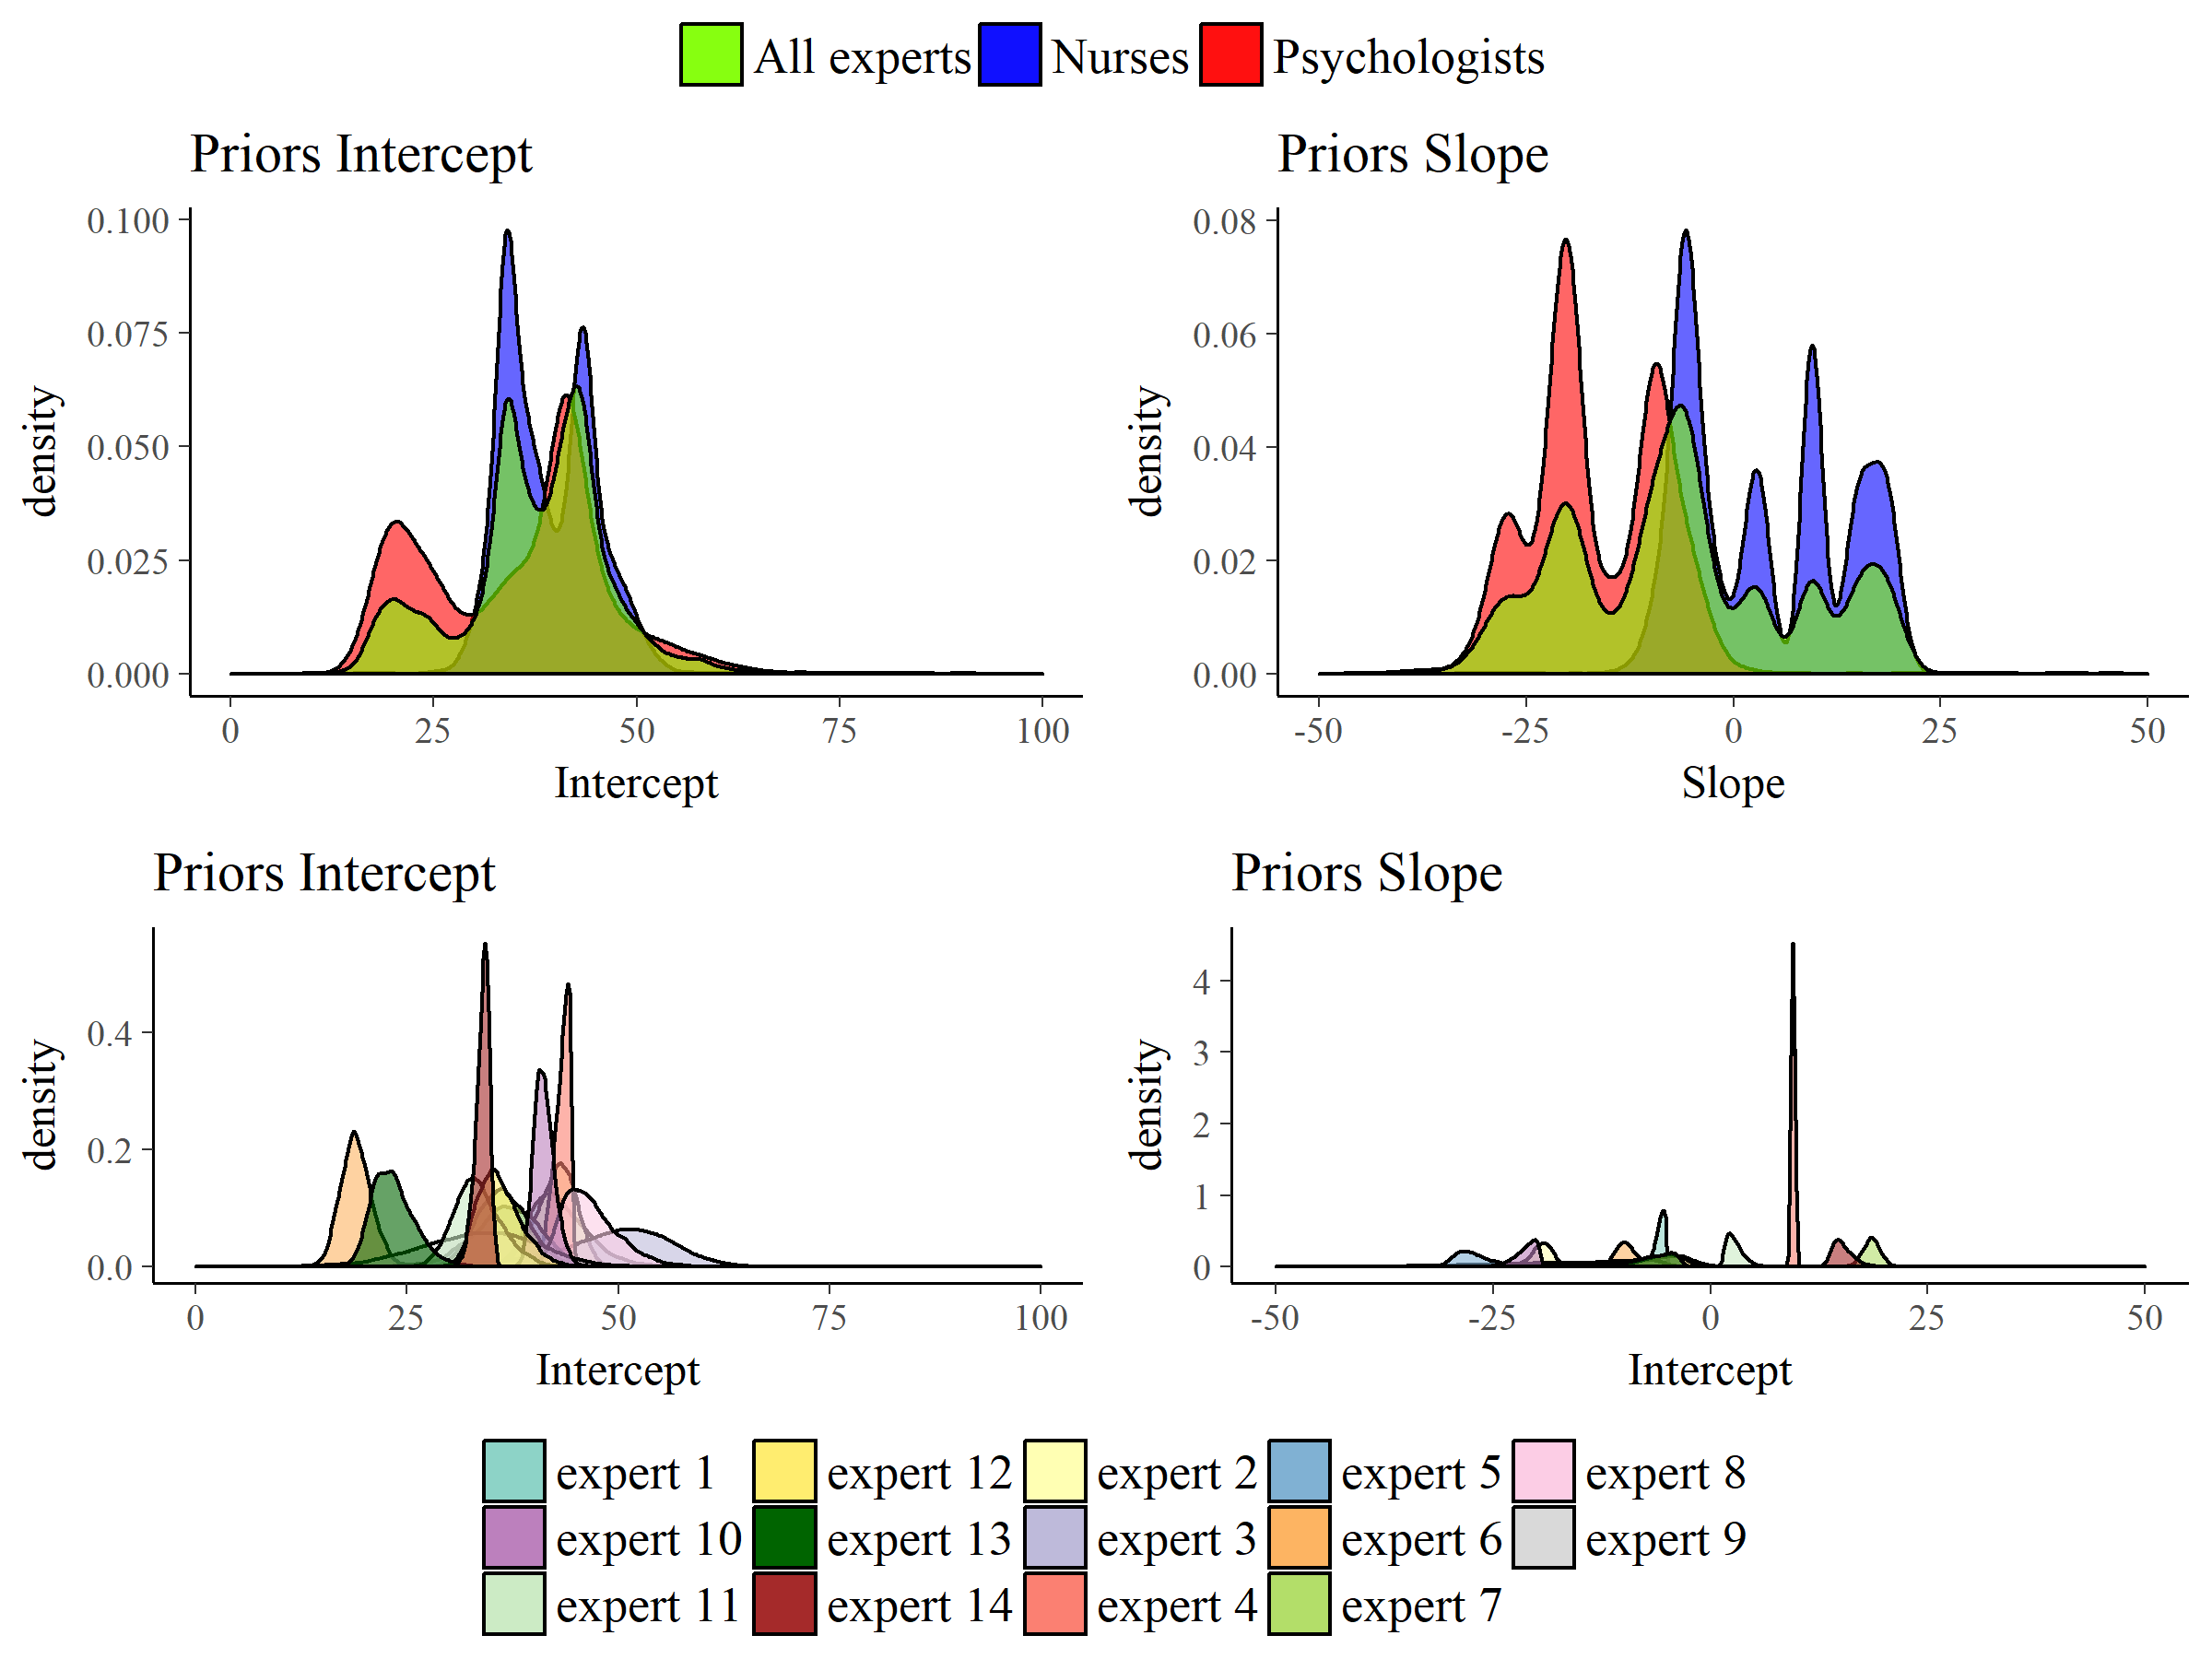
Figure 6.6: Elicited prior distributions from all experts and the associated mixture priors for all experts, the psychologists group and the nurses group regarding both the mean intercept and the mean slope of PTSS development.
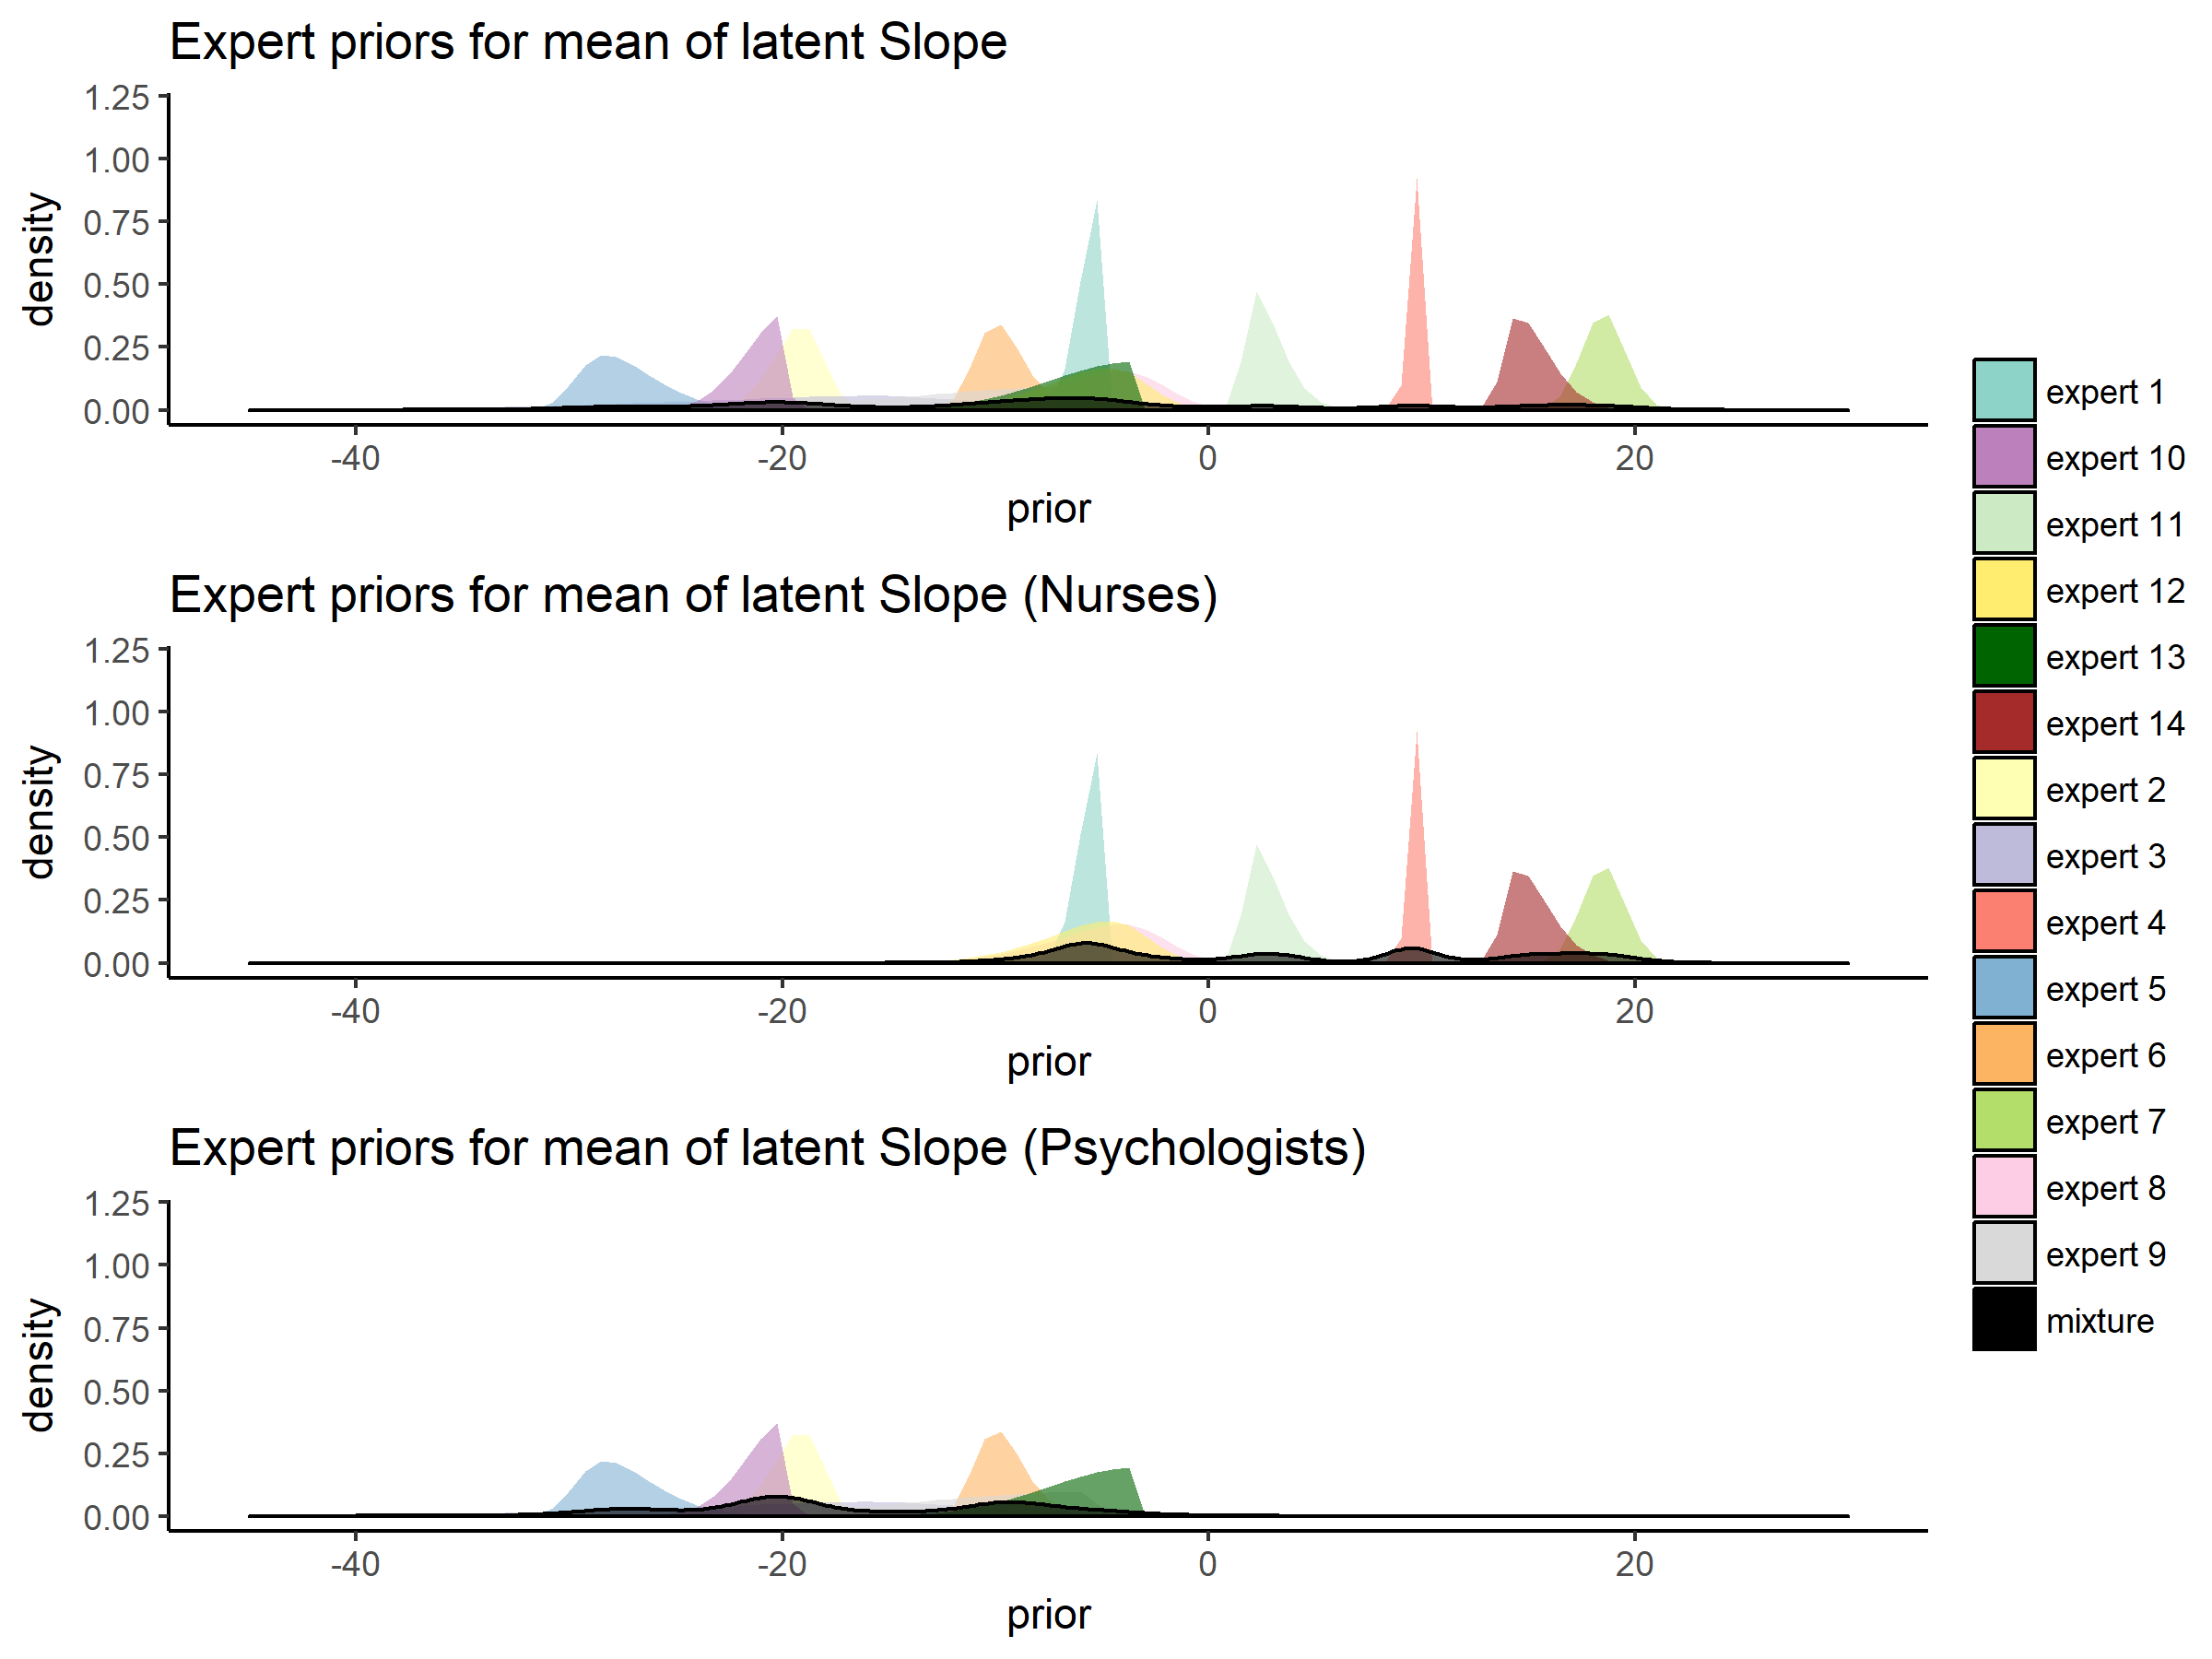
Figure 6.7: Elicited prior distributions from all experts and the associated mixture priors for all experts, the psychologists group and the nurses group regarding the mean slope of PTSS development. There was a notable difference in expert judgements between the psychologists and the nurses groups.
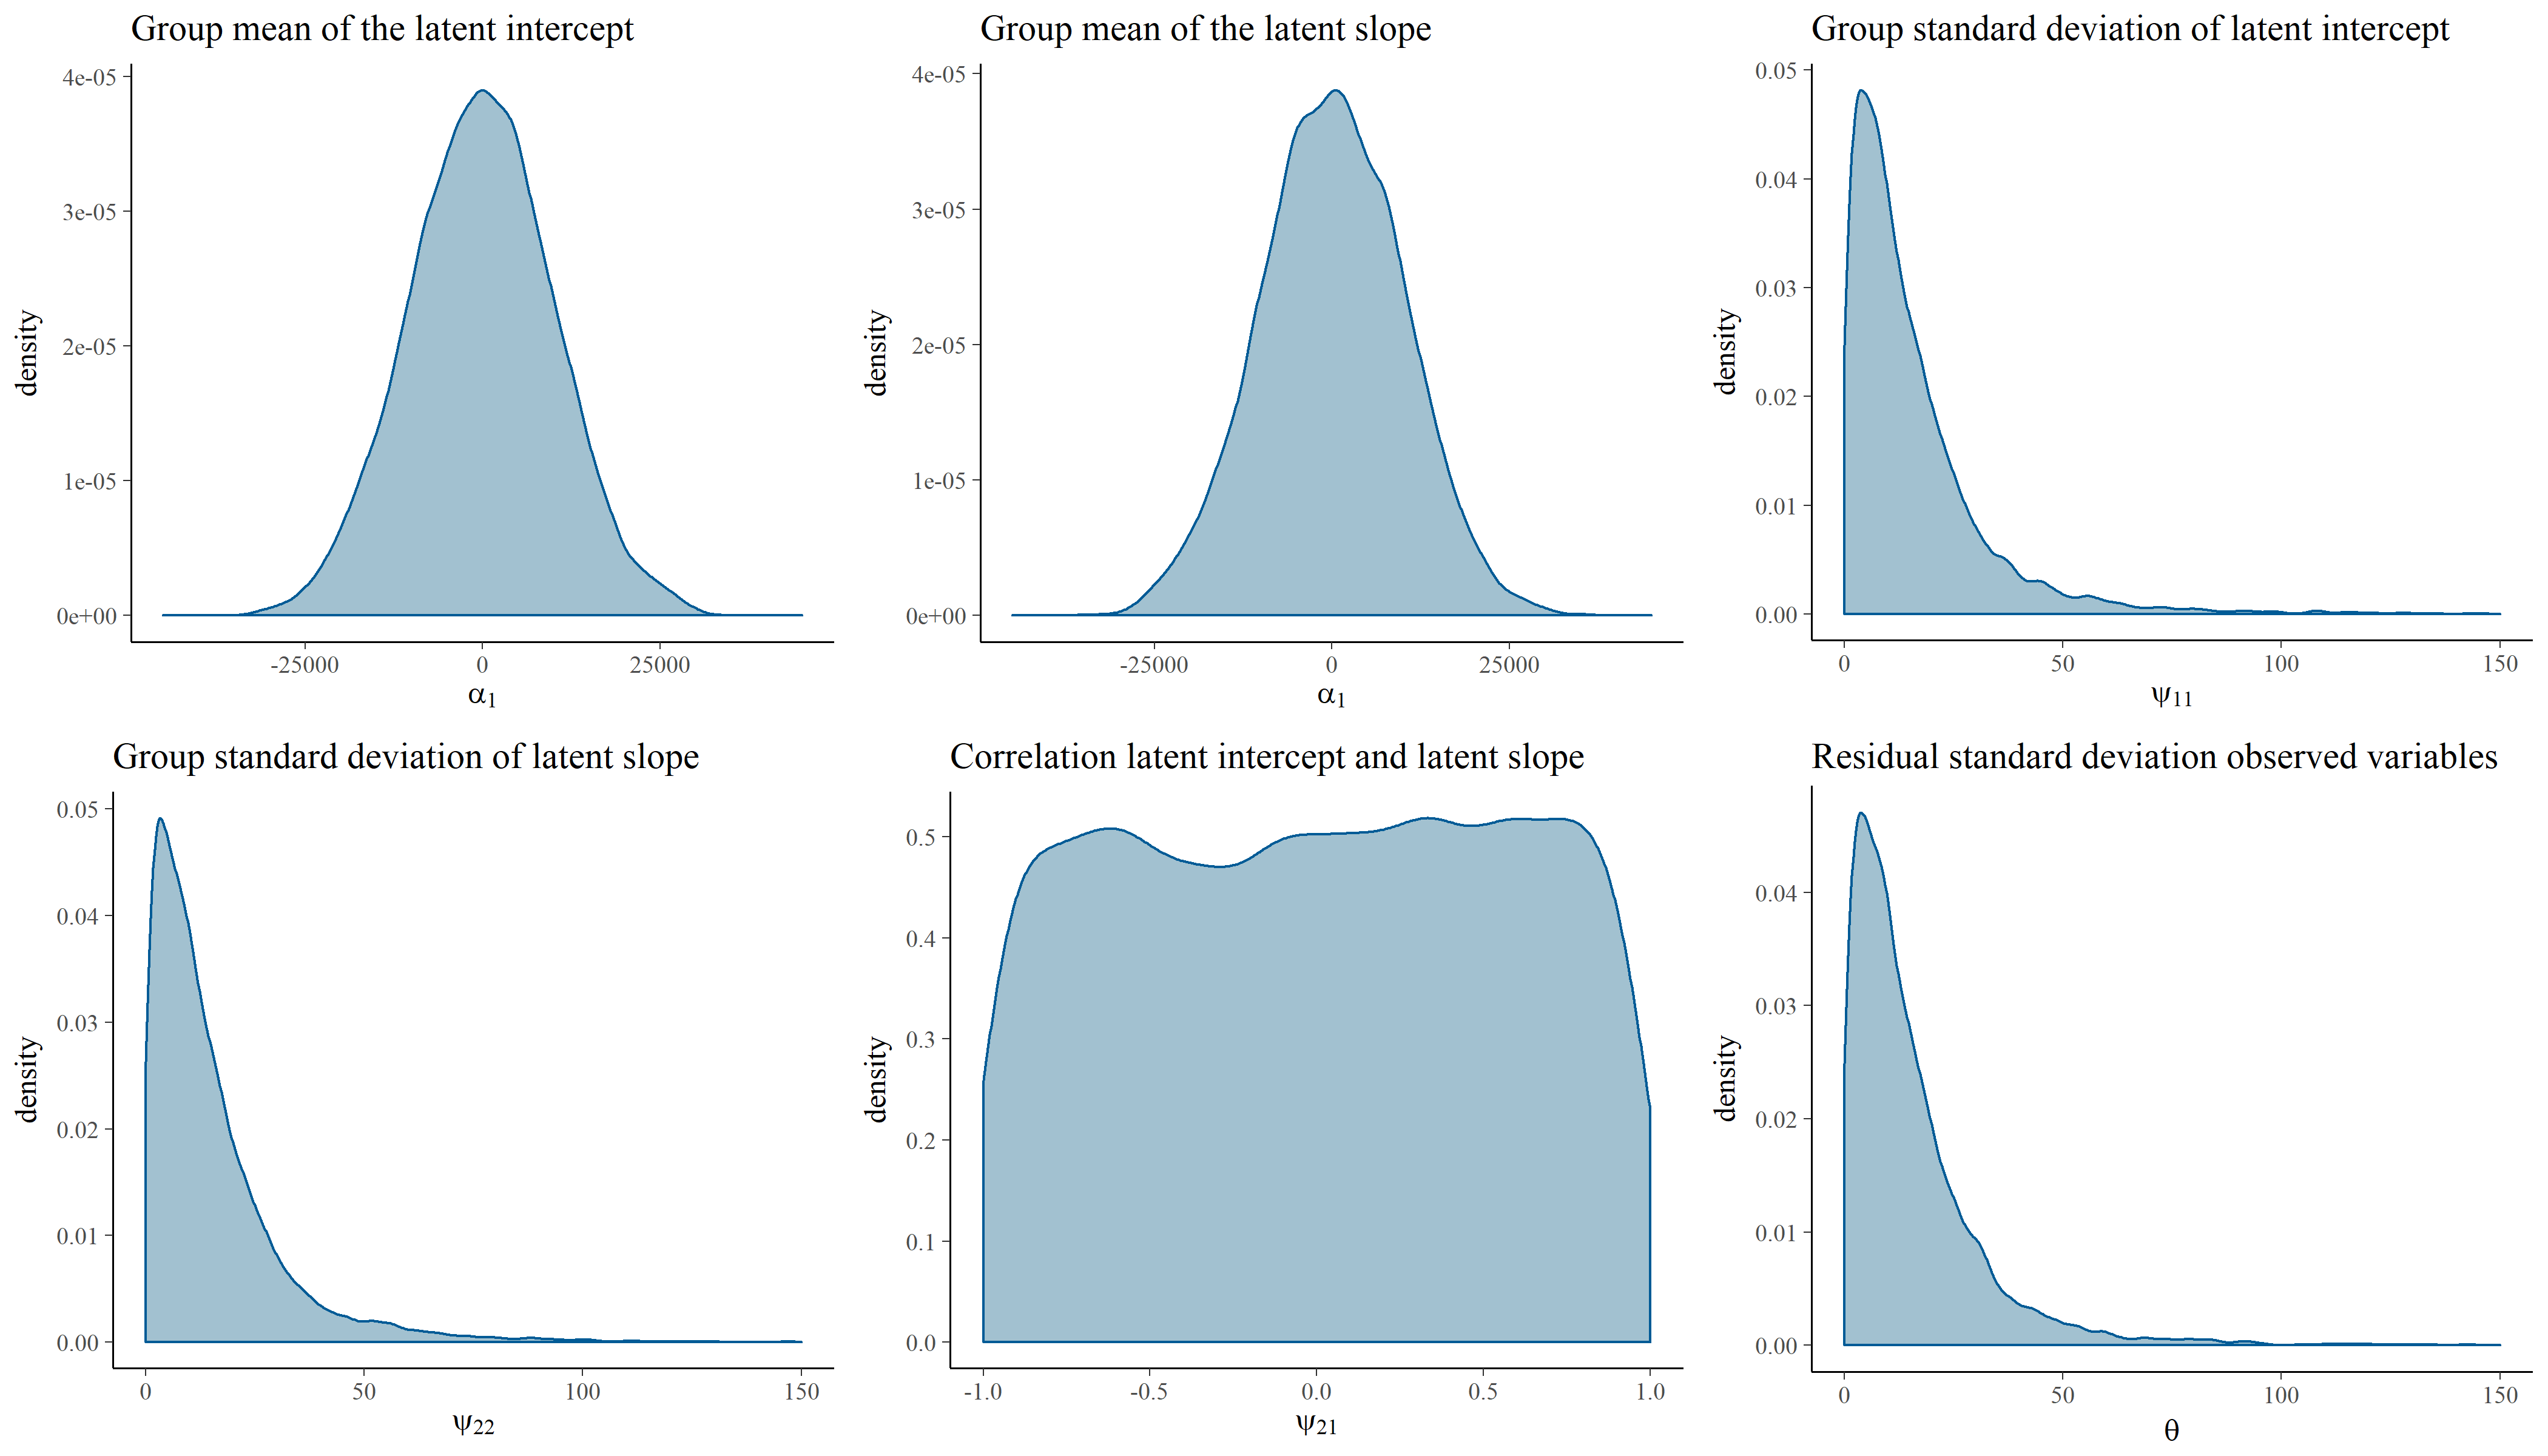
Figure 6.8: Visual representation of the prior distributions that are used to obtain the reference posterior. The prior distributions are \(\alpha_1 \sim N(0, 10^8)\), \(\alpha_2 \sim N(0, 10^8)\), \(\psi_{11} \sim half-t(3, 0, 196)\), \(\psi_{22} \sim half-t(3, 0, 196)\), \(\psi_{21} \sim U(-1, 1)\), and \(\theta \sim half-t(3, 0, 196)\).
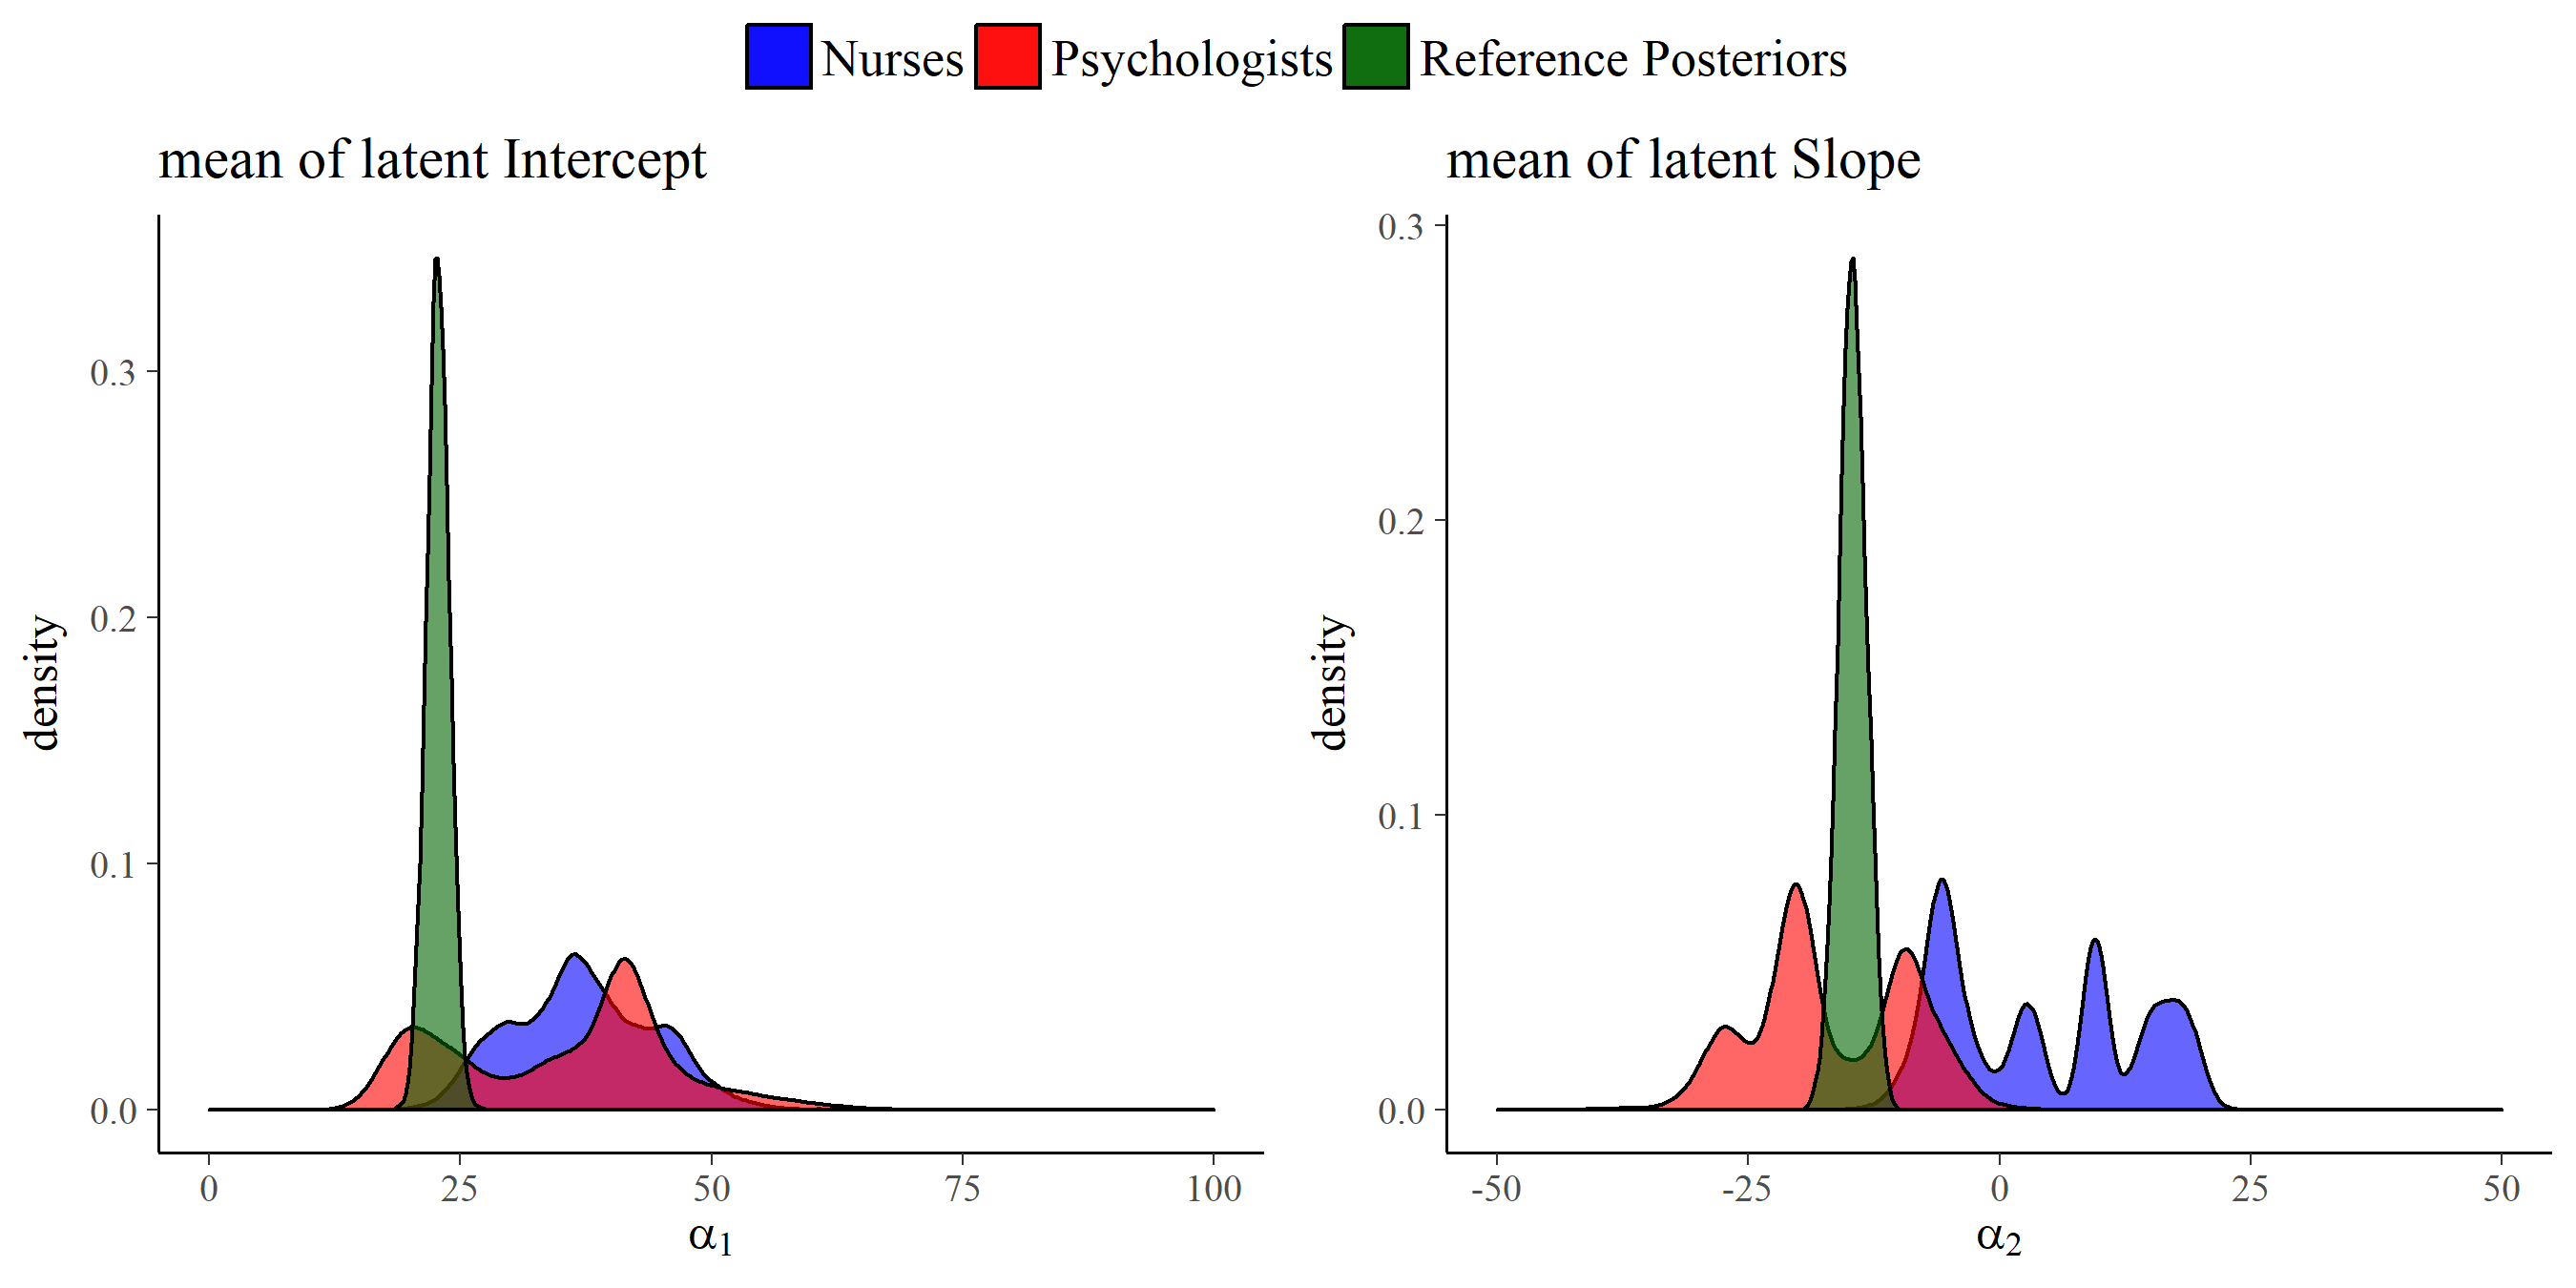
Figure 6.9: Visual representation of the reference posterior distributions for the group mean of latent intercept and slope with the group expert priors for the parameters. The reference posteriors are approximately distributed \(\alpha_1 \sim N(22.7, 1.3)\), and \(\alpha_2 \sim N(-14.6, 1.9)\).
| Intercept | Slope | |
|---|---|---|
| Benchmark 1 | 3.04 | 3.56 |
| Benchmark 2 | 8.56 | 8.39 |
| Nurses | 8.19 | 5.88 |
| Psychologists | 1.99 | 2.18 |
| All | 2.72 | 2.63 |
| Expert 1 | 42.87 | 59.18 |
| Expert 2 | 45.16 | 25.87 |
| Expert 3 | 6.71 | 1.23 |
| Expert 4 | 72.86 | 55.38 |
| Expert 5 | 5.66 | 98.32 |
| Expert 6 | 2.10 | 22.17 |
| Expert 7 | 79.20 | 59.61 |
| Expert 8 | 46.97 | 4.37 |
| Expert 9 | 2.48 | 1.28 |
| Expert 10 | 43.74 | 67.55 |
| Expert 11 | 12.78 | 64.56 |
| Expert 12 | 99.94 | 4.88 |
| Expert 13 | 0.35 | 3.62 |
| Expert 14 | 75.00 | 74.11 |
6.4 Discussion
We were able to elicit expert judgements with respect to the development of PTSS in young burn victims from 14 experts and contrasted this with data collected in a traditional way by means of a questionnaire. This study demonstrated differences in views between experts. On an individual basis the experts were particularly in disagreement with regards to the change of PTSS one year post-burn. Many experts do not overlap with each other in their beliefs when we look at the elicited probability distributions for the slope parameter. The expert judgements not only differed from one individual to the next, but it may be that there is a relationship between the experts’ role in the post-burn treatment process and their view on the childrens’ development of PTSS. The two groups of experts notably differed in the aggregated elicited judgements. Moreover, the aggregated judgements of the psychologists seemed to align with the data collected by Egberts et al. (2018) whilst the nurses judgements seemed to differ.
With respect to the differences between the two groups of experts the most remarkable difference was found with respect to the slope parameter. The aggregated views of the groups of experts result in distributions with more uncertainty compared to the individual experts’ beliefs. The dispersed views of the experts put together ensure coverage of a larger part of the parameters space than the individual expert judgements do. Interestingly, the more uncertain distributions still clearly present a separation of the views regarding the development of PTSS in young burn victims between the nurses expert group on the one hand and the psychologists expert group and the data collected by Egberts et al. (2018) on the other hand. The aggregated judgements from the psychologists assigned almost no probability to the group average PTSS increasing one year post-burn. The aggregated judgements from the nurses, in contrast, assigned a lot of probability to an increase of the group average PTSS one year post-burn. As there is no grounded truth that we cannot conclude which views are a better or worse representation. However, the results do indicate that the nurses and the psychologists are not in agreement on what happens with respect to the development of PTSS in young burn victims. The audio recordings of the elicitation settings provided a possible explanation for this important distinction. All psychologists at some point during the elicitation referred to, or specifically mentioned, the construct of PTSS. The group of nurses mentioned several sources of distress but only two nurses actually referred back to PTSS, one of which also judged the one year post-burn PTSS to decrease. As burn victims indeed can experience other sources of distress, e.g. related to the development of scar tissue or operations they have to undergo, nurses might have convoluted PTSS symptoms with other patient symptoms. This could also explain why the aggregated nurses’ view judged the initial PTSS level to be higher for the group average than the aggregated psychologists’ view. Overall, the differences might reflect the fact that psychologists are trained to diagnose and treat PTSS, whereas nurses are primarily concerned with procedural and physical care for the patient, and are not responsible for diagnosing and treating PTSS.
Besides differences between the nurses and the psychologists we also found a substantial difference between the reference posteriors, that provided a representation of the data from Egberts et al. (2018), and the aggregated nurses prior. In Figure 6.9 it can be seen that the psychologists’ views overlapped with the reference posteriors. The nurses’ views however did almost not overlap with reference posteriors. This could also numerically be assessed, as was done with the KL-divergences in Table 6.1. Because the aggregated nurses prior had little overlap with the reference posteriors the Benchmark 1 priors, uniform priors that takes the information of the measurement instrument into account, outperformed this group in terms of loss of information. This implies the data collected by Egberts et al. (2018) was better approximated by an uninformed expression of the measurement properties of the questionnaire than by the nurses’ group prior. The children in the study by Egberts et al. (2018) expressed a lower quantity of PTSS in their self-reported questionnaires compared to the nurses’ expert judgements on PTSS symptoms for this populations. There can be several explanations for this discrepancy, first the questionnaire might have resulted in underreporting of symptoms, a view also expressed by one of the experts. In line with this, Egberts et al. (2018) found that mothers gave higher ratings of their child’s PTSS compared to the children themselves, although mothers’ ratings also appeared to be influenced by their own symptoms of PTSS. Also, fathers did not report higher ratings of PTSS compared to their children. Alternatively, the discrepancy could be explained by the elicitation of the expert judgements. Especially the nurses group reported higher PTSS levels compared to the self-reports and the previously mentioned convolution of symptoms and lack of specific knowledge about PTSS might be a cause for this observation. In the recordings of the elicitation settings we found another possible cause. Five of the nurses expressed sentiments that the more severe cases came to mind more easily and therefore might be overrepresented in their beliefs. This is a clear expression of the well known availability heuristic (Tversky & Kahneman, 1973) that can cause biases in elicitation studies (O’Hagan et al., 2006). In the psychologists group only a single expert expressed a similar remark. The availability heuristic, if not remedied, might cause the discrepancy between the reference posteriors and the expert judgements.
The study showed that providing visual feedback on the representation of the experts’ beliefs can lead to adjustments by the experts to their input such that obvious incorrect representations of the experts’ beliefs are remedied. Unfortunately it is not possible to validate that the representation of the experts’ beliefs is actually the “true” beliefs of the expert (Colson & Cooke, 2018; O’Hagan et al., 2006). However, one of the main reasons to use elicitation software is to ameliorate the effects of heuristics and biases by getting experts to actively reflect on the probability distribution that will be used to represent their beliefs. In the recordings three experts actively reflect on their distributions and adjust them based on the visual feedback and for this the purpose the elicitation software seems to have worked well. Nevertheless, it seems from our current study that even with the graphical feedback, some experts might still suffer from overconfidence, see Figure 6.6. Expert 11, for instance, stated “… of course, I have a lot of uncertainty anyway.”. However, this does not seem reflected in the elicited distribution which has a 99% CI for the latent intercept [27.2, 41.7] and the latent slope [1.2, 5.9]. As the experts were only available to us for a limited time we did not provide a specialized training aimed at elicitation and overcoming heuristics associated with elicitation tasks which might be a limitation for the current study, and the associated (individual level) results.
This study indicated that aggregating expert judgements could potentially mitigate the severity of the individual biases, as one thereby relies less on single, possibly overconfident, experts. The aggregation of all experts’ judgements, or only the psychologists’ judgements, lead to less discrepancy between the traditionally collected data and the elicited beliefs than mostly any individual expert and the benchmarks. Aggregating or pooling of expert judgements into a single distribution is common in elicitation studies and can be done in several manners. In our current study we used opinion pooling with equal weights (O’Hagan et al., 2006, Chapter 9). Alternatively, there is much literature on how expert judgements could be weighted in the aggregation of views. The classical model (Cooke, 1991, Chapter 12) is one of the foremost examples of this. In the classical approach calibration questions are used to assess the experts. Based on the calibration questions experts’ judgements on the target question, or question of interest, are weighted to together form the groups weighted prior beliefs. The calibration questions should be related to the question of interest and their answers should be known but not to the experts (Colson & Cooke, 2018). It is recommended to have at least eight to ten calibration questions if dealing with continuous variables (Cooke, 1991, Chapter 12). The experts are elicited concerning the question of interest and the calibration questions. Their answers on the calibration questions are evaluated against the known true values and the experts are rated on their informativeness and accuracy (Colson & Cooke, 2018; Cooke, 1991). The ratings of the weighting components is based upon the idea of KL-divergences (O’Hagan et al., 2006, Chapter 9) such as we used to compare the experts’ judgements against the collected data on the question of interest directly. As far as we know there have not been any studies using the classical approach in the social sciences. Finding calibration questions turns out to be a hard problem, as knowing the true answer to these questions is required. We described the KL-divergence between the target question and the experts’ judgements, but calibrating experts based on these weight would be putting emphasis on the traditionally collected data twice. As the traditionally collected data might suffer from biases too, consider for instance the total survey error framework (Groves et al., 2011, Chapter 2) including nonresponse error and measurement error, this double emphasis might not be desirable. Instead, our equal weights aggregation approach relied on the inclusion of experts with balance in views and diversity in backgrounds (Cooke & Goossens, 1999).
In conclusion, it is possible to express the experts’ domain knowledge as prior distributions using the described methodology and compare these elicited distributions to traditionally collected data. The individual expert judgements in general show quite some discrepancy in comparison to traditionally collected data, although there are notable exceptions to this. When taking the mixtures of the groups of experts the discrepancy becomes less pronounced, very much so for the psychologists group. The psychologists mixture prior has less KL-divergence than mostly any individual expert and notably less KL-divergence than benchmark 1, the uniform prior that takes the information of the measurement instrument into account. The expert judgements add information to the research area and exploring (dis)similarities between expert judgements and traditional data open up two exciting avenues for future research. First, the collection of data on the experts that might be predictive for the amount of KL-divergence they exhibit with respect to traditionally collected data. Second, the organisation of a Delphi like setting with all experts after the individual judgements are collected and compared with traditional data. The group setting can provide insights into the reasons behind the discrepancies between traditional collected data, individual experts and groups of experts. Predicting and explaining (dis)similarities between experts judgements and traditional data such as results of questionnaires can be a potential new line of research for the social sciences.
Conflicts of Interest
The authors declare that the research was conducted in the absence of any commercial or financial relationships that could be construed as a potential conflict of interest.
Ethics Statement
This study was carried out in accordance with the recommendations of the internal Ethics Committee of the Faculty of Social and Behavioural Sciences of Utrecht University, with written informed consent from all subjects. All subjects gave written informed consent in accordance with the Declaration of Helsinki. The protocol was approved by the internal Ethics Committee of the Faculty of Social and Behavioural Sciences of Utrecht University.
Acknowledgements
The authors are grateful to all experts for their invested time and energy.
Funding
This work was supported by Grant NWO-VIDI-452-14-006 from the Netherlands Organization for Scientific Research. None of the funders or sponsors of this research had any role in the design and conduct of the study; collection, management, analysis, and interpretation of data; preparation, review, or approval of the manuscript; or decision to submit the manuscript for publication.
References
Alisic, E., Eland, J., Huijbregts, R., & Kleber, R. (2011). Manual of the children’s responses to trauma inventory - revised edition.[Handleiding bij de schokverwerkingslijst voor kinderen-herziene versie]. Diemen/Utrecht, the Netherlands: Institute for Psychotrauma in Collaboration with Utrecht University and University Medical Center Utrecht.
Alisic, E., Eland, J., & Kleber, R. (2006). Children’s Responses to Trauma Inventory-Revised Version [Schokverwerkingslijst Voor Kinderen-Herziene Versie]. Zaltbommel/Utrecht, the Netherlands: Institute for Psychotrauma in Collaboration with Utrecht University and University Medical Center Utrecht.
Barons, M. J., Wright, S. K., & Smith, J. Q. (2018). Eliciting probabilistic judgements for integrating decision support systems. In L. C. Dias, A. Morton, & J. Quigley (Eds.), Elicitation (pp. 445–478). Springer.
Bojke, L., Claxton, K., Bravo-Vergel, Y., Sculpher, M., Palmer, S., & Abrams, K. (2010). Eliciting distributions to populate decision analytic models. Value in Health, 13(5), 557–564.
Bousquet, N. (2008). Diagnostics of prior-data agreement in applied Bayesian analysis. Journal of Applied Statistics, 35(9), 1011–1029.
Buist, K. L., Dekovic, M., Meeus, W., & van Aken, M. A. (2002). Developmental patterns in adolescent attachment to mother, father and sibling. Journal of Youth and Adolescence, 31(3), 167–176.
Burkner, P.-C. (2019). Parameterization of Response Distributions in brms. Retrieved from https://cran.r-project.org/web/packages/brms/vignettes/brms_families.html
Catts, H. W., Bridges, M. S., Little, T. D., & Tomblin, J. B. (2008). Reading achievement growth in children with language impairments. Journal of Speech, Language, and Hearing Research.
Chang, W., Cheng, J., Allaire, J., Xie, Y., & McPherson, J. (2019). Shiny: Web application framework for r. Retrieved from https://CRAN.R-project.org/package=shiny
Colson, A. R., & Cooke, R. M. (2018). Expert elicitation: Using the classical model to validate experts‘ judgments. Review of Environmental Economics and Policy, 12(1), 113–132.
Cooke, R. M. (1991). Experts in uncertainty: Opinion and subjective probability in science. Oxford University Press on Demand.
Cooke, R. M., & Goossens, L. H. J. (2008). TU Delft expert judgment data base. Reliability Engineering & System Safety, 93(5), 657–674.
Cooke, R. M., & Goossens, L. J. H. (1999). Procedures guide for structured expert judgment. Brussels: Commission of the European Communities.
Dewispelare, A. R., Herren, L. T., & Clemen, R. T. (1995). The use of probability elicitation in the high-level nuclear waste regulation program. International Journal of Forecasting, 11(1), 5–24.
Dodd, P. J., Yuen, C. M., Sismanidis, C., Seddon, J. A., & Jenkins, H. E. (2017). The global burden of tuberculosis mortality in children: A mathematical modelling study. The Lancet Global Health, 5(9), e898–e906.
Duncan, T. E., & Duncan, S. C. (2004). An introduction to latent growth curve modeling. Behavior Therapy, 35(2), 333–363.
Egberts, M. R., van de Schoot, R., Geenen, R., & van Loey, N. E. (2018). Mother, father and child traumatic stress reactions after paediatric burn: Within-family co-occurrence and parent-child discrepancies in appraisals of child stress. Burns, 44(4), 861–869.
Elfadaly, F. G., & Garthwaite, P. H. (2017). Eliciting Dirichlet and Gaussian copula prior distributions for multinomial models. Statistics and Computing, 27(2), 449–467.
Fischer, K., Lewandowski, D., & Janssen, M. (2013). Estimating unknown parameters in haemophilia using expert judgement elicitation. Haemophilia, 19(5), e282–e288.
Fisher, R., O’Leary, R. A., Low-Choy, S., Mengersen, K., & Caley, M. J. (2012). A software tool for elicitation of expert knowledge about species richness or similar counts. Environmental Modelling & Software, 30, 1–14.
Garthwaite, P. H., Al-Awadhi, S. A., Elfadaly, F. G., & Jenkinson, D. J. (2013). Prior distribution elicitation for generalized linear and piecewise-linear models. Journal of Applied Statistics, 40(1), 59–75.
Goldstein, D. G., & Rothschild, D. (2014). Lay understanding of probability distributions. Judgment & Decision Making, 9(1).
Gosling, J. P. (2018). SHELF: The Sheffield elicitation framework. In Elicitation (pp. 61–93). Springer.
Gronau, Q. F., Ly, A., & Wagenmakers, E.-J. (2019). Informed Bayesian t-tests. The American Statistician, 1–14.
Groves, R. M., Fowler Jr, F. J., Couper, M. P., Lepkowski, J. M., Singer, E., & Tourangeau, R. (2011). Survey methodology (Vol. 561). John Wiley & Sons.
Haakma, W., Steuten, L. M., Bojke, L., & IJzerman, M. J. (2014). Belief elicitation to populate health economic models of medical diagnostic devices in development. Applied Health Economics and Health Policy, 12(3), 327–334.
Hald, T., Aspinall, W., Devleesschauwer, B., Cooke, R., Corrigan, T., Havelaar, A. H., … Angulo, F. J. (2016). World Health Organization estimates of the relative contributions of food to the burden of disease due to selected foodborne hazards: A structured expert elicitation. PloS One, 11(1), e0145839.
Hampson, L. V., Whitehead, J., Eleftheriou, D., & Brogan, P. (2014). Bayesian methods for the design and interpretation of clinical trials in very rare diseases. Statistics in Medicine, 33(24), 4186–4201.
Hampson, L. V., Whitehead, J., Eleftheriou, D., Tudur-Smith, C., Jones, R., Jayne, D., … Caldas, A. (2015). Elicitation of expert prior opinion: Application to the MYPAN trial in childhood polyarteritis nodosa. PLoS One, 10(3), e0120981.
Ho, C.-H., & Smith, E. I. (1997). Volcanic hazard assessment incorporating expert knowledge: Application to the Yucca Mountain region, Nevada, USA. Mathematical Geology, 29(5), 615–627.
James, A., Choy, S. L., & Mengersen, K. (2010). Elicitator: An expert elicitation tool for regression in ecology. Environmental Modelling & Software, 25(1), 129–145.
Kullback, S., & Leibler, R. A. (1951). On information and sufficiency. The Annals of Mathematical Statistics, 22(1), 79–86.
Lek, K., & van de Schoot, R. (2018). Development and evaluation of a digital expert elicitation method aimed at fostering elementary school teachers’ diagnostic competence. In (Vol. 3, p. 82). Frontiers.
Lek, K., & van de Schoot, R. (2019). How the Choice of Distance Measure Influences the Detection of Prior-Data Conflict. Entropy, 21(5), 446.
Little, T. D. (2013). Longitudinal structural equation modeling. Guilford press.
Little, T. D., Bovaird, J. A., & Slegers, D. W. (2006). Methods for the analysis of change. Handbook of Personality Development, 181–211.
Low-Choy, S., James, A., Murray, J., & Mengersen, K. (2012). Elicitator: A user-friendly, interactive tool to support scenario-based elicitation of expert knowledge. In Expert knowledge and its application in landscape ecology (pp. 39–67). Springer.
Morris, D. E., Oakley, J. E., & Crowe, J. A. (2014). A web-based tool for eliciting probability distributions from experts. Environmental Modelling & Software, 52, 1–4.
Murphy, A. H., & Winkler, R. L. (1974). Subjective probability forecasting experiments in meteorology: Some preliminary results. Bulletin of the American Meteorological Society, 55(10), 1206–1216.
Murphy, A. H., & Winkler, R. L. (1984). Probability forecasting in meteorology. Journal of the American Statistical Association, 79(387), 489–500.
Oakley, J. (2019). SHELF: Tools to support the sheffield elicitation framework. Retrieved from https://CRAN.R-project.org/package=SHELF
O’Hagan, A., Buck, C. E., Daneshkhah, A., Eiser, J. R., Garthwaite, P. H., Jenkinson, D. J., … Rakow, T. (2006). Uncertain judgements: Eliciting experts’ probabilities. John Wiley & Sons.
Orth, U., Robins, R. W., & Widaman, K. F. (2012). Life-span development of self-esteem and its effects on important life outcomes. Journal of Personality and Social Psychology, 102(6), 1271.
Runge, A. K., Scherbaum, F., Curtis, A., & Riggelsen, C. (2013). An interactive tool for the elicitation of subjective probabilities in probabilistic seismic‐hazard analysis. Bulletin of the Seismological Society of America, 103(5), 2862–2874.
Truong, P. N., Heuvelink, G. B., & Gosling, J. P. (2013). Web-based tool for expert elicitation of the variogram. Computers & Geosciences, 51, 390–399.
Tversky, A., & Kahneman, D. (1973). Availability: A heuristic for judging frequency and probability. Cognitive Psychology, 5(2), 207–232.
van de Schoot, R., Sijbrandij, M., Depaoli, S., Winter, S. D., Olff, M., & van Loey, N. E. (2018). Bayesian PTSD-trajectory analysis with informed priors based on a systematic literature search and expert elicitation. Multivariate Behavioral Research, 53(2), 267–291.
van de Schoot, R., Winter, S. D., Ryan, O., Zondervan-Zwijnenburg, M., & Depaoli, S. (2017). A systematic review of Bayesian articles in psychology: The last 25 years. Psychological Methods, 22(2), 217.
Veen, D., Stoel, D., Schalken, N., Mulder, K., & van de Schoot, R. (2018). Using the Data Agreement Criterion to Rank Experts’ Beliefs. Entropy, 20(8), 592.
Veen, D., Stoel, D., Zondervan-Zwijnenburg, M., & van de Schoot, R. (2017). Proposal for a Five-Step Method to Elicit Expert Judgement. Frontiers in Psychology, 8, 2110.
Zondervan-Zwijnenburg, M., van de Schoot-Hubeek, W., Lek, K., Hoijtink, H., & van de Schoot, R. (2017b). Application and evaluation of an expert judgment elicitation procedure for correlations. Frontiers in Psychology, 8, 90.
Note that the mixtures are based on normal approximations of the elicited skewed normal distributions due to computational instability of the mixture distributions when skewed normal expert priors where used.↩